
Figure 3.
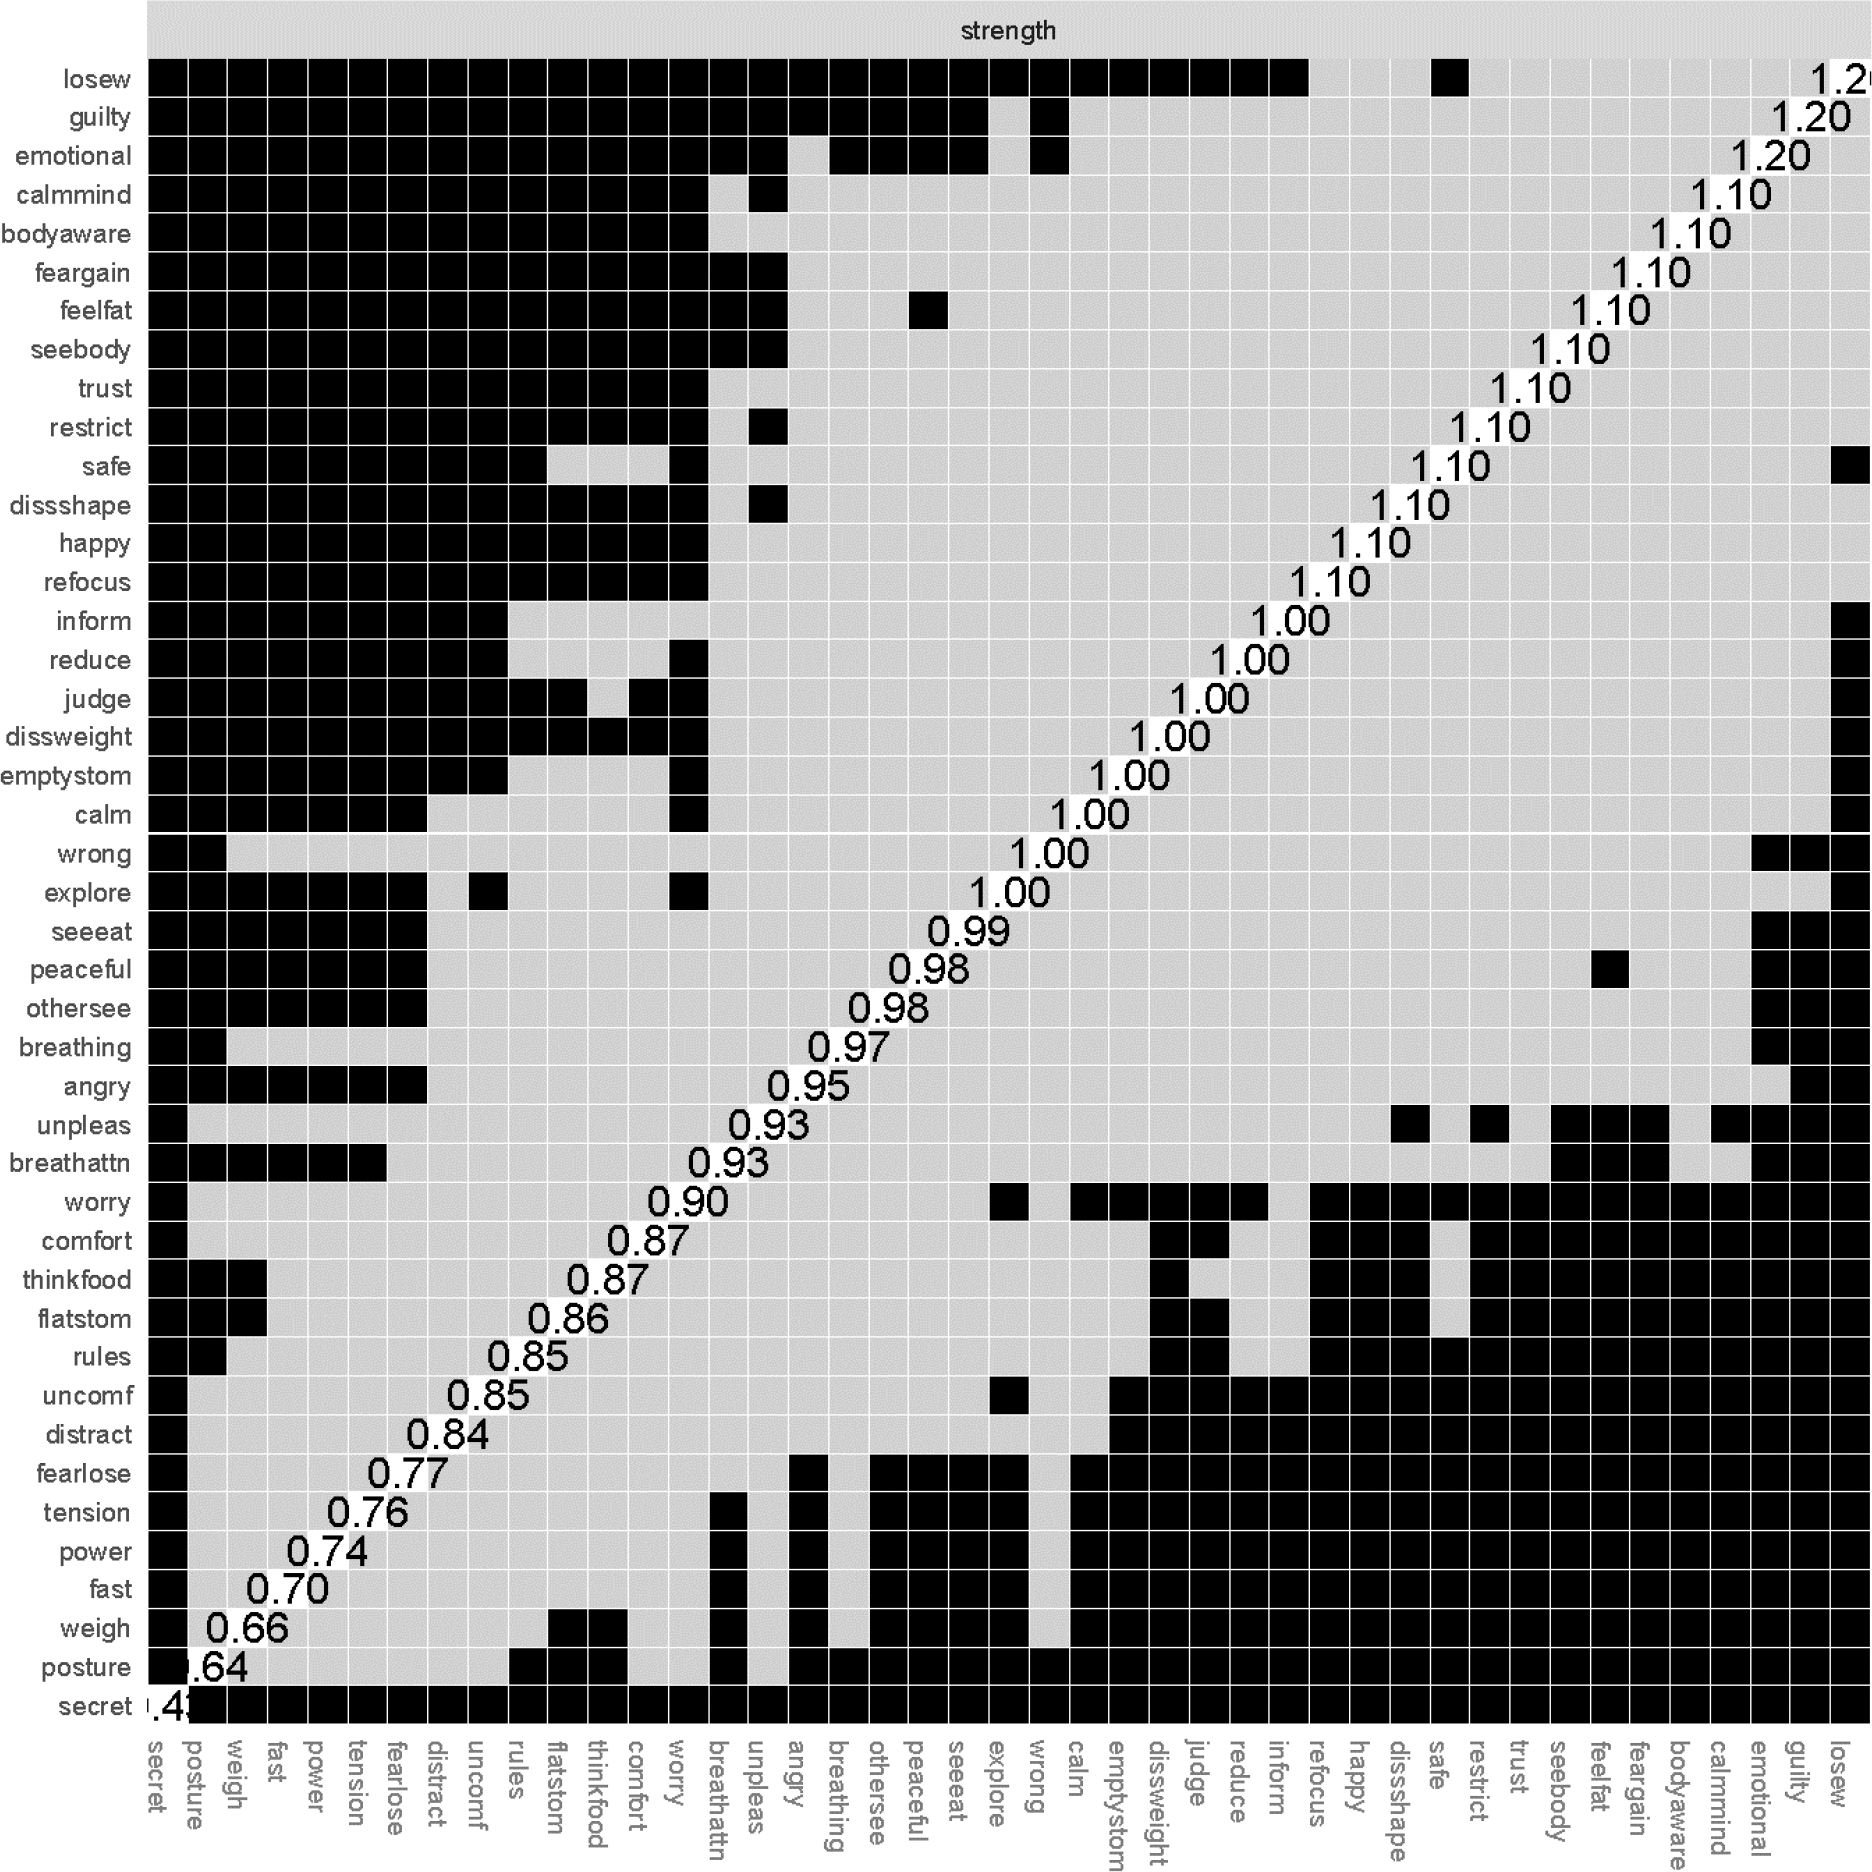
Strength centrality difference graph.
Symptoms are presented in descending order of strength. Values on the diagonal indicate unstandardized strength values. Black squares indicate statistically significant difference between nodes at p < .05.