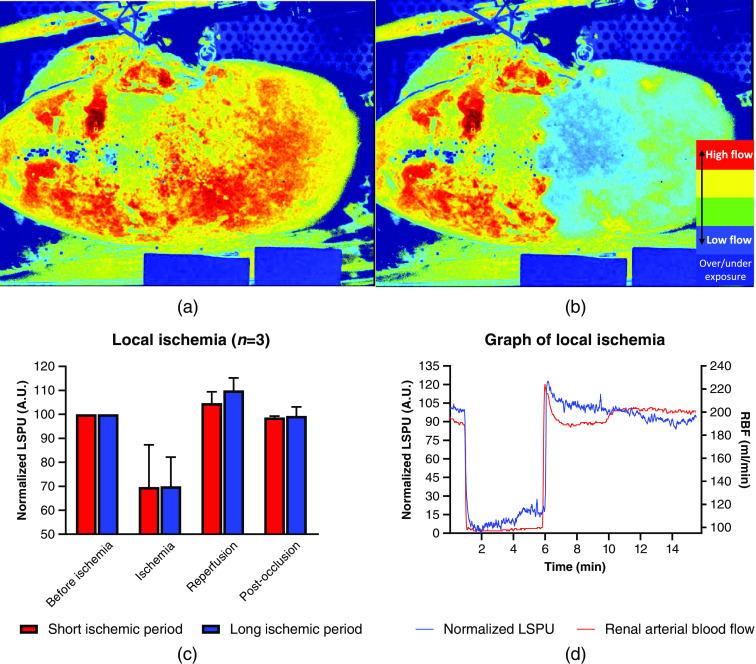
Fig. 5.
The inflation of a balloon catheter in an arterial bifurcation induces a local ischemic area. The local ischemia was induced consecutively for a short (5 min) and long (15 min) period in each kidney. (a) Pseudo-color image of the RCM before induction of local ischemia made using LSCI. (b) Pseudo-color images of the RCM while local ischemia is induced made using LSCI. (c) Relative drop of the RCM measured in LSPU in A.U. for the short and long ischemic period. The results are normalized on the average of the baseline period. (d) A typical local ischemia trace measured by RBF (ml/min) and the RCM in normalized LSPU (A.U.) where the LSPU is normalized on the min/max of the whole local ischemia experiment (Video 1, MP4, 8.2 MB [URL: https://doi.org/10.1117/1.JBO.26.5.056004.1]).

