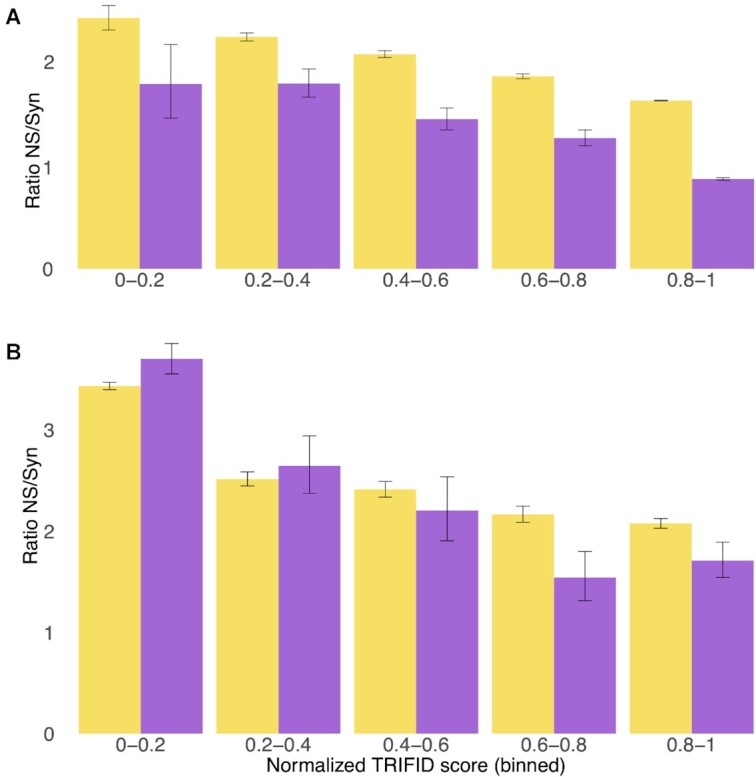
Figure 8.

TRIFID scores and genomic variation for principal and alternative exons. (A) Non-synonymous to synonymous ratios for rare (yellow) and common allele frequencies (purple) for exons from principal transcripts binned by the TRIFID score of the transcript. (B) Non-synonymous to synonymous ratios for rare (yellow) and common allele frequencies (purple) for exons that do not overlap principal transcripts binned by the TRIFID score of their transcript. Error bars show the confidence intervals for each subset of exons.
