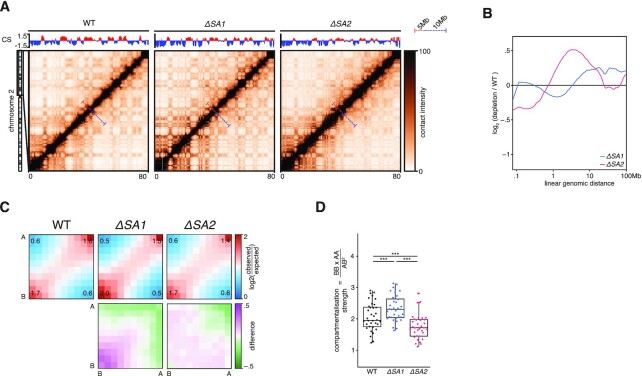
Figure 4.
Far-cis differences between the cohesin-variants. (A) Hi-C matrices of chromosome 2p of wild-type, ΔSA1 and ΔSA2. Compartment-scores are plotted on top. Bars in matrices denote 5mb and 10mb distances in red and blue, respectively. (B) Relative contact probabilities compared to wild-type in log2-space, with blue denoting ΔSA1 and red denoting ΔSA2. (C) Saddle-plots (top) and differential saddles (bottom), with purple denoting more interactions in the sample compared to the wild-type. Annotated values are the average enrichment in the 2 × 2 squares of the respective corners. (D) Boxplot of the compartmentalisation-strength per chromosome-arm (dots). *** indicates paired t-test P < .005.

