Figure 5.
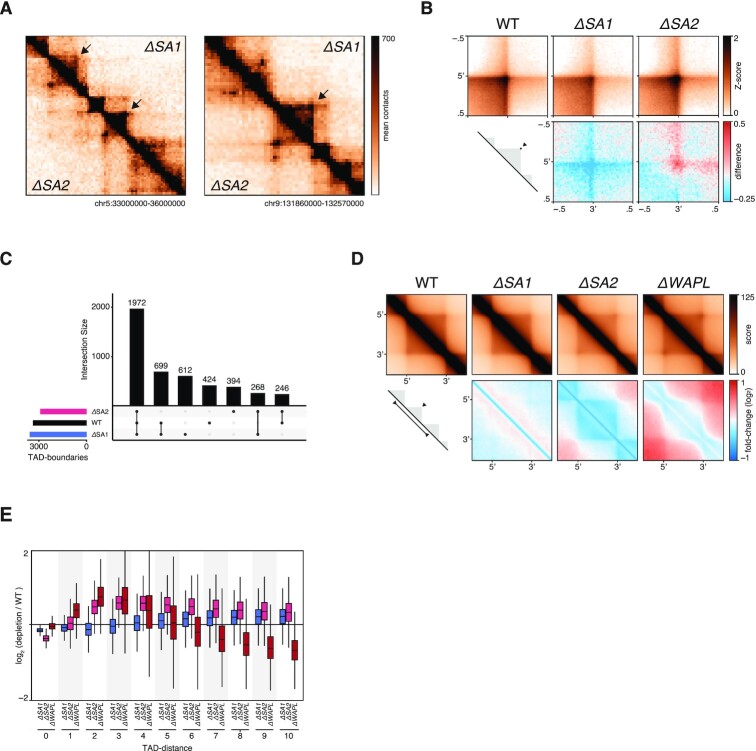
CohesinSA1-only cells have diminished intra-TAD contacts. (A) Snapshots of two regions on chromosome 5 and chromosome 9, showing ΔSA1 in top-right and ΔSA2 in bottom-left triangle. (B) Aggregate Peak Analysis on TAD-corners in wild-type, ΔSA1, ΔSA2 and ΔWAPL (top). Differential APA compared to wild-type (bottom), with red denoting increased interactions in the specific sample. (C) Intersections of called TAD-boundaries in wild-type, ΔSA1 and ΔSA2. (D) Aggregate TAD analysis of Hap1 TADs in wild-type, ΔSA1, ΔSA2 and ΔWAPL (top). Differential ATA compared to wild-type (bottom), with blue denoting loss of interactions in the specific sample. (E) TAD-neighbour analysis: interactions between TADs, stratified on the number of TADs in between, compared to wild-type.

