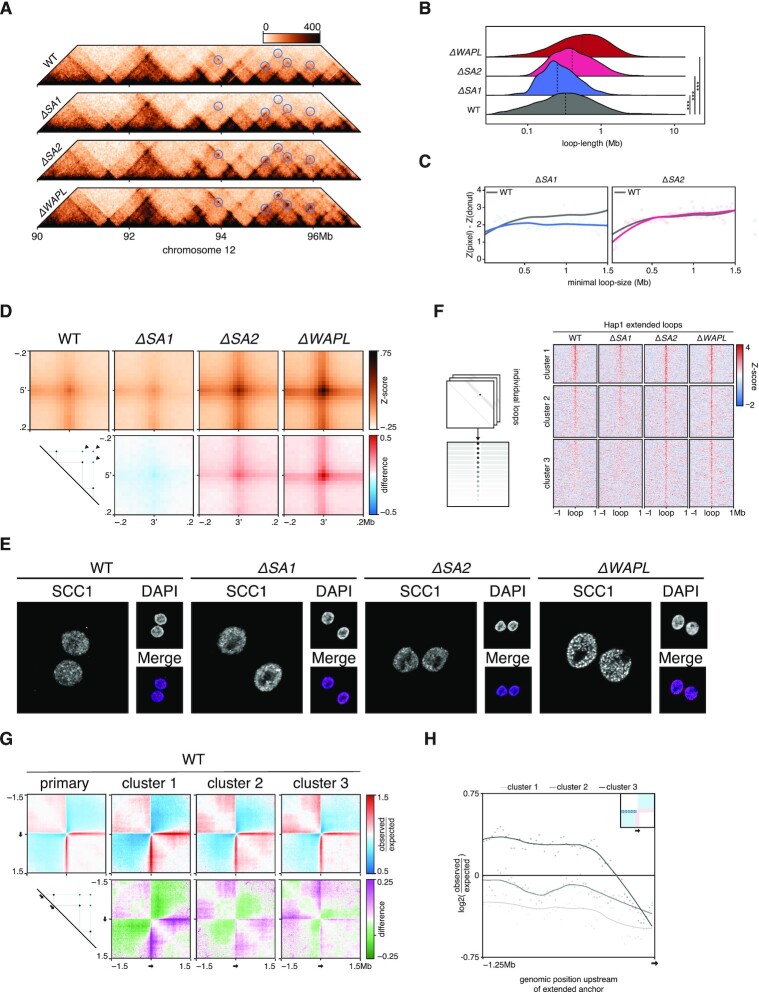
Figure 6.
Extended loops in ΔSA2 are formed at bidirectional loop-anchors. (A) Pyramid-plots of wildtype, ΔSA1, ΔSA2 and ΔWAPL at chromosome 12. Predicted loop-extensions, based on wild-type anchors, are indicated in blue circles. (B) Length-quantification of loops called by HICCUPS in wild-type, ΔSA1, ΔSA2 and ΔWAPL. Dashed line denotes median. (C) Contact-enrichment of loops versus surrounding 250kb at different loop-lengths. Grey line denotes wild type average signal. (D) Aggregate peak analysis of the predicted extended loops in wild-type and the three knockouts (top). Differential plots comparing knockouts to wild-type are shown in the bottom row, where red indicates an enrichment in the knockout. (E) Immunofluorescence of DNA-bound SCC1, showing the vermicelli-phenotype in ΔWAPL. (F) The aggregate tornado-plot extracts the signal around and at every individual loop visualises them as a heatmap, with a loop at every row (left). A K = 3 clustered tornado on the APA-discovery object of Figure 6D. Cluster 3 harbors ΔSA2- and ΔWAPL-specific extended loops. (G) Aggregate region analysis on wild-type data, using upstream anchors of all loops (primary) and those of the extended loops from the clusters found in Figure 6E. (H) Quantification of the upstream regions from the ARA of Figure 6G.

