
Figure 3.
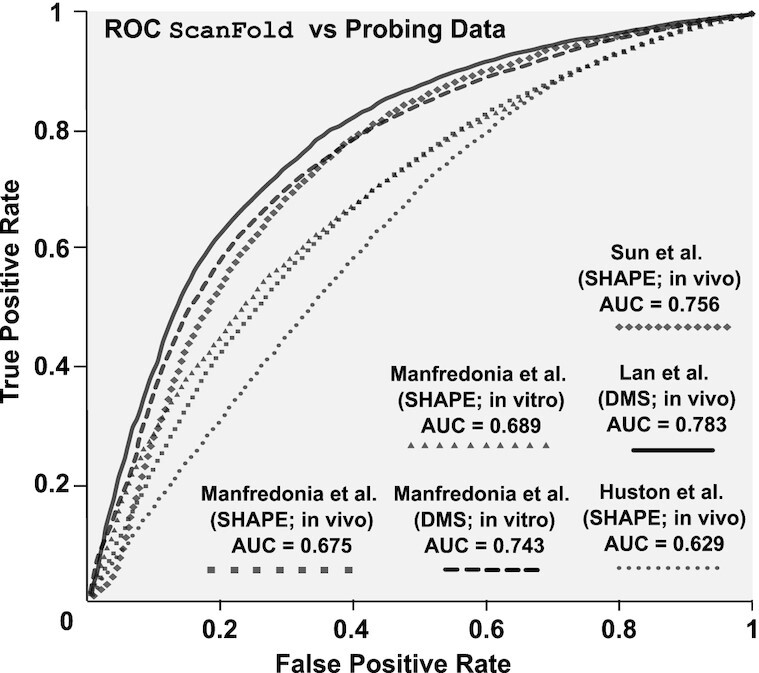
Comparisons of ScanFold vs. experimental data. Receiver-operating characteristic (ROC) analysis of the in silico (at a 120 nt analysis window) ScanFold-Fold predicted base pair structure of SARS-CoV-2 against SHAPE and DMS reactivity data sets generated from SARS-CoV-2 probing experiments. Reactivities are progressively evaluated from the lowest reactivity values to the highest, at intervals of 1% of the total number of reactivity values (see Materials and Methods) and compared to the ScanFold predicted secondary structure yielding a true positive rate (y axis) and a false positive rate (x axis). Progressively increasing reactivity thresholds have their respective TPR and FPR plotted from 0% (coordinate (0,0)) to 100% (coordinate (1,1)) and each respective dataset is indicated by a line with a unique marker (see figure legend). The area under the curve (AUC) is calculated for each curve (listed in the figure legend and Supplementary Table S6) and is an indication of how well the reactivity datasets agree with the in silicoScanFold-Fold predicted structure.