
Figure 4.
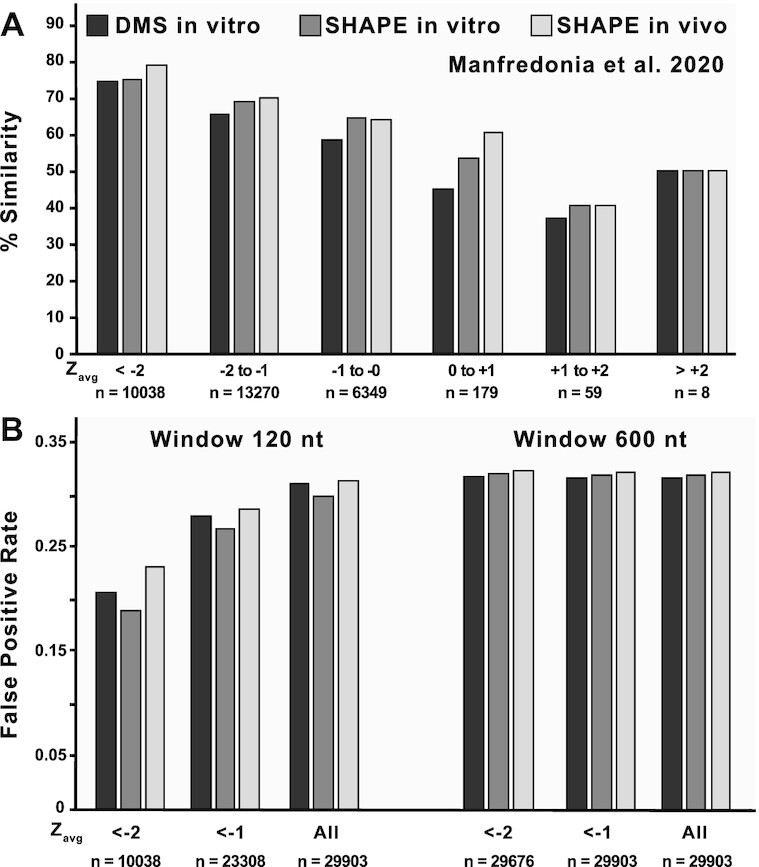
Comparisons of in silicoScanFoldZavg values against three different reactivity-informed secondary structural models of SARS-CoV-2. (A) In silicoScanFold Zavg values were binned based on their magnitude from < -2 to > +2 at intervals of 1 and are labelled across the x axis along with the number of values that are present in each bin. The positions corresponding to each Zavg value were cross referenced between the in silicoScanFold predicted secondary structure of SARS-CoV-2 and the three model conditions proposed by Manfredonia et al. (DMS in vitro, black shading; SHAPE in vitro, dark gray shading; SHAPE in vivo, light gray shading) to calculate a percent similarity which is plotted on the y axis. Across all three model conditions, the lowest Zavg bins consistently have the highest similarity to the reactivity informed global models. (B) The < -1 and < -2 binned Zavg values for in silicoScanFold models of SARS-CoV-2, at both a 120 and 600 nt analysis window, were compared to the three separate models from Manfredonia et al. and a false positive rate (FPR) was calculated. The Zavg bins are labelled across the x axis along with the number of nt positions associated with each bin and the FPR is plotted along the y axis. For the 120nt scanning analysis window, the most negative Zavg bin (i.e. < -2) had the lowest FPR compared to the < -1 Zavg bin and the All Zavg bin (which had the highest FPR). The distribution of Zavg values for the ScanFold model utilizing a 600 nt analysis window were significantly shifted to be more negative, resulting in almost all (>99%) of the Zavg values to be in the < -2 bin, therefore there is little variation in the FPR for these Zavg bins and the FPR in all bins are higher compared to the < -2 bin utilizing the 120 nt analysis window.