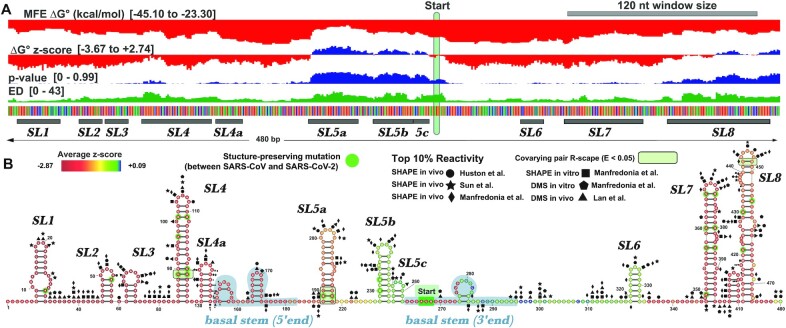
Figure 5.
Full analysis of the 5′ UTR of SARS-CoV-2. (A) The results of the full ScanFold pipeline are shown. ScanFold metrics and base pairs have been loaded into the IGV desktop browser (91). Metric type and ranges are shown on the left side of the panel (metric descriptions can be found in Material and Methods). Here the start codon has been highlighted with a green bar and structures which correspond to previously named elements have been annotated. (B) ScanFold RNA 2D structures are shown for the 5′ UTR. All base pairs shown are consistent between SARS-CoV and SARS-CoV-2, and nucleotide variations which are present within structures have been highlighted with green circles. Structures have been visualized here using VARNA (92). Top 10% of reactivities are shown for Manfredoina et al. (squares, pentagons and diamonds), Huston et al. (circles), Sun et al. (stars) and Lan et al. (triangles) at their corresponding nt positions (17–20).

