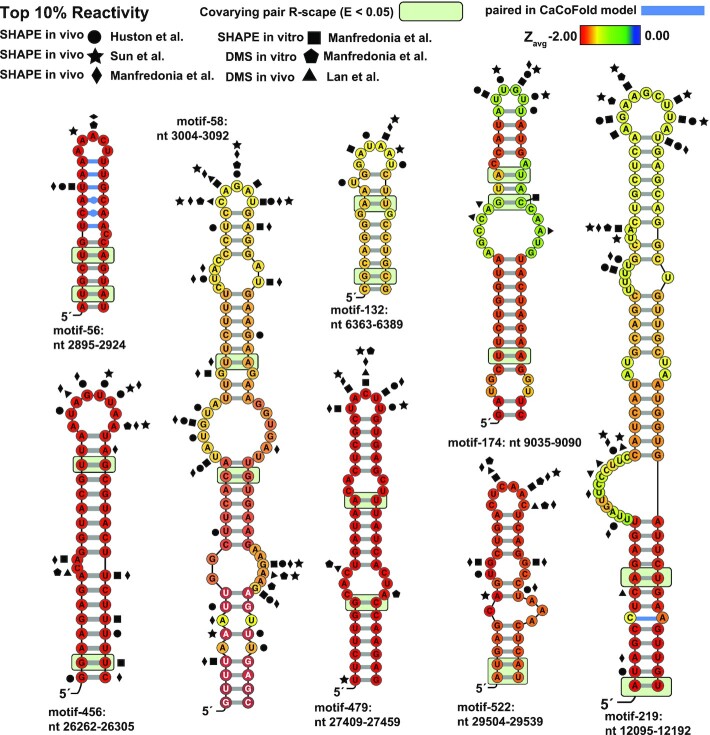
Figure 6.
ScanFold predicted motifs annotated with conservation and probing data. Nucleotides are colored based on the Zavg value predicted in the standard ScanFold run. Particularly interesting base pairs which were identified in CaCoFold models are shown in blue. Significantly covarying bps (R-scape APC corrected G-test; E<0.05) have been highlighted with a green box. Nucleotide coordinates are relative to the SARS-CoV-2 reference genome NC_045512.2. Top 10% of reactivities are shown for Manfredoina et al. (squares, pentagons and diamonds), Huston et al., (circles), Sun et al. (stars) and Lan et al. (triangles) at their corresponding nt positions (17–20).

