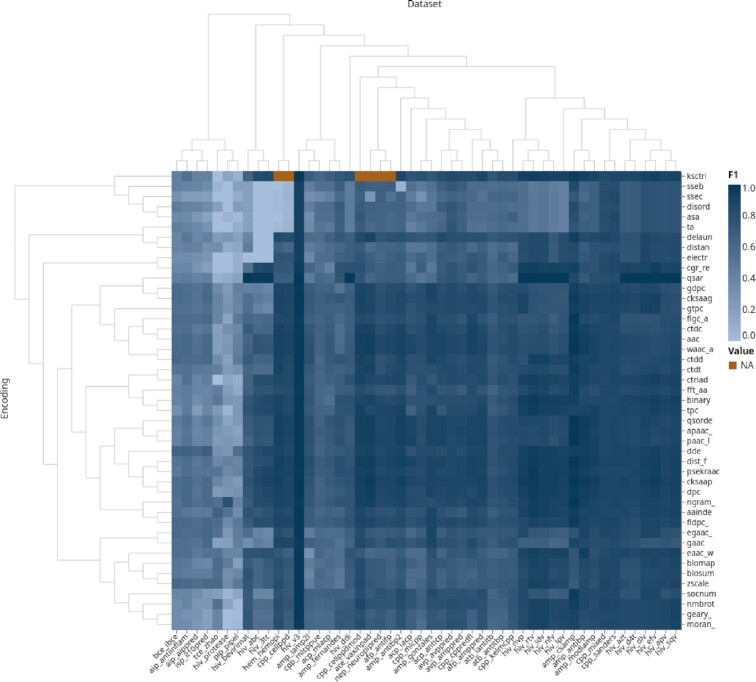
Figure 4.
Encoding groups performance, clustered by biomedical domain and encoding group. Color coding corresponds to the max F1-score of a group. The x-axis is arranged by clustering datasets, i.e. the biomedical application. The y-axis is organized by clustering sequence- and structure-based encodings. An interactive version of this plot can be found at https://peptidereactor.mathematik.uni-marburg.de/.

