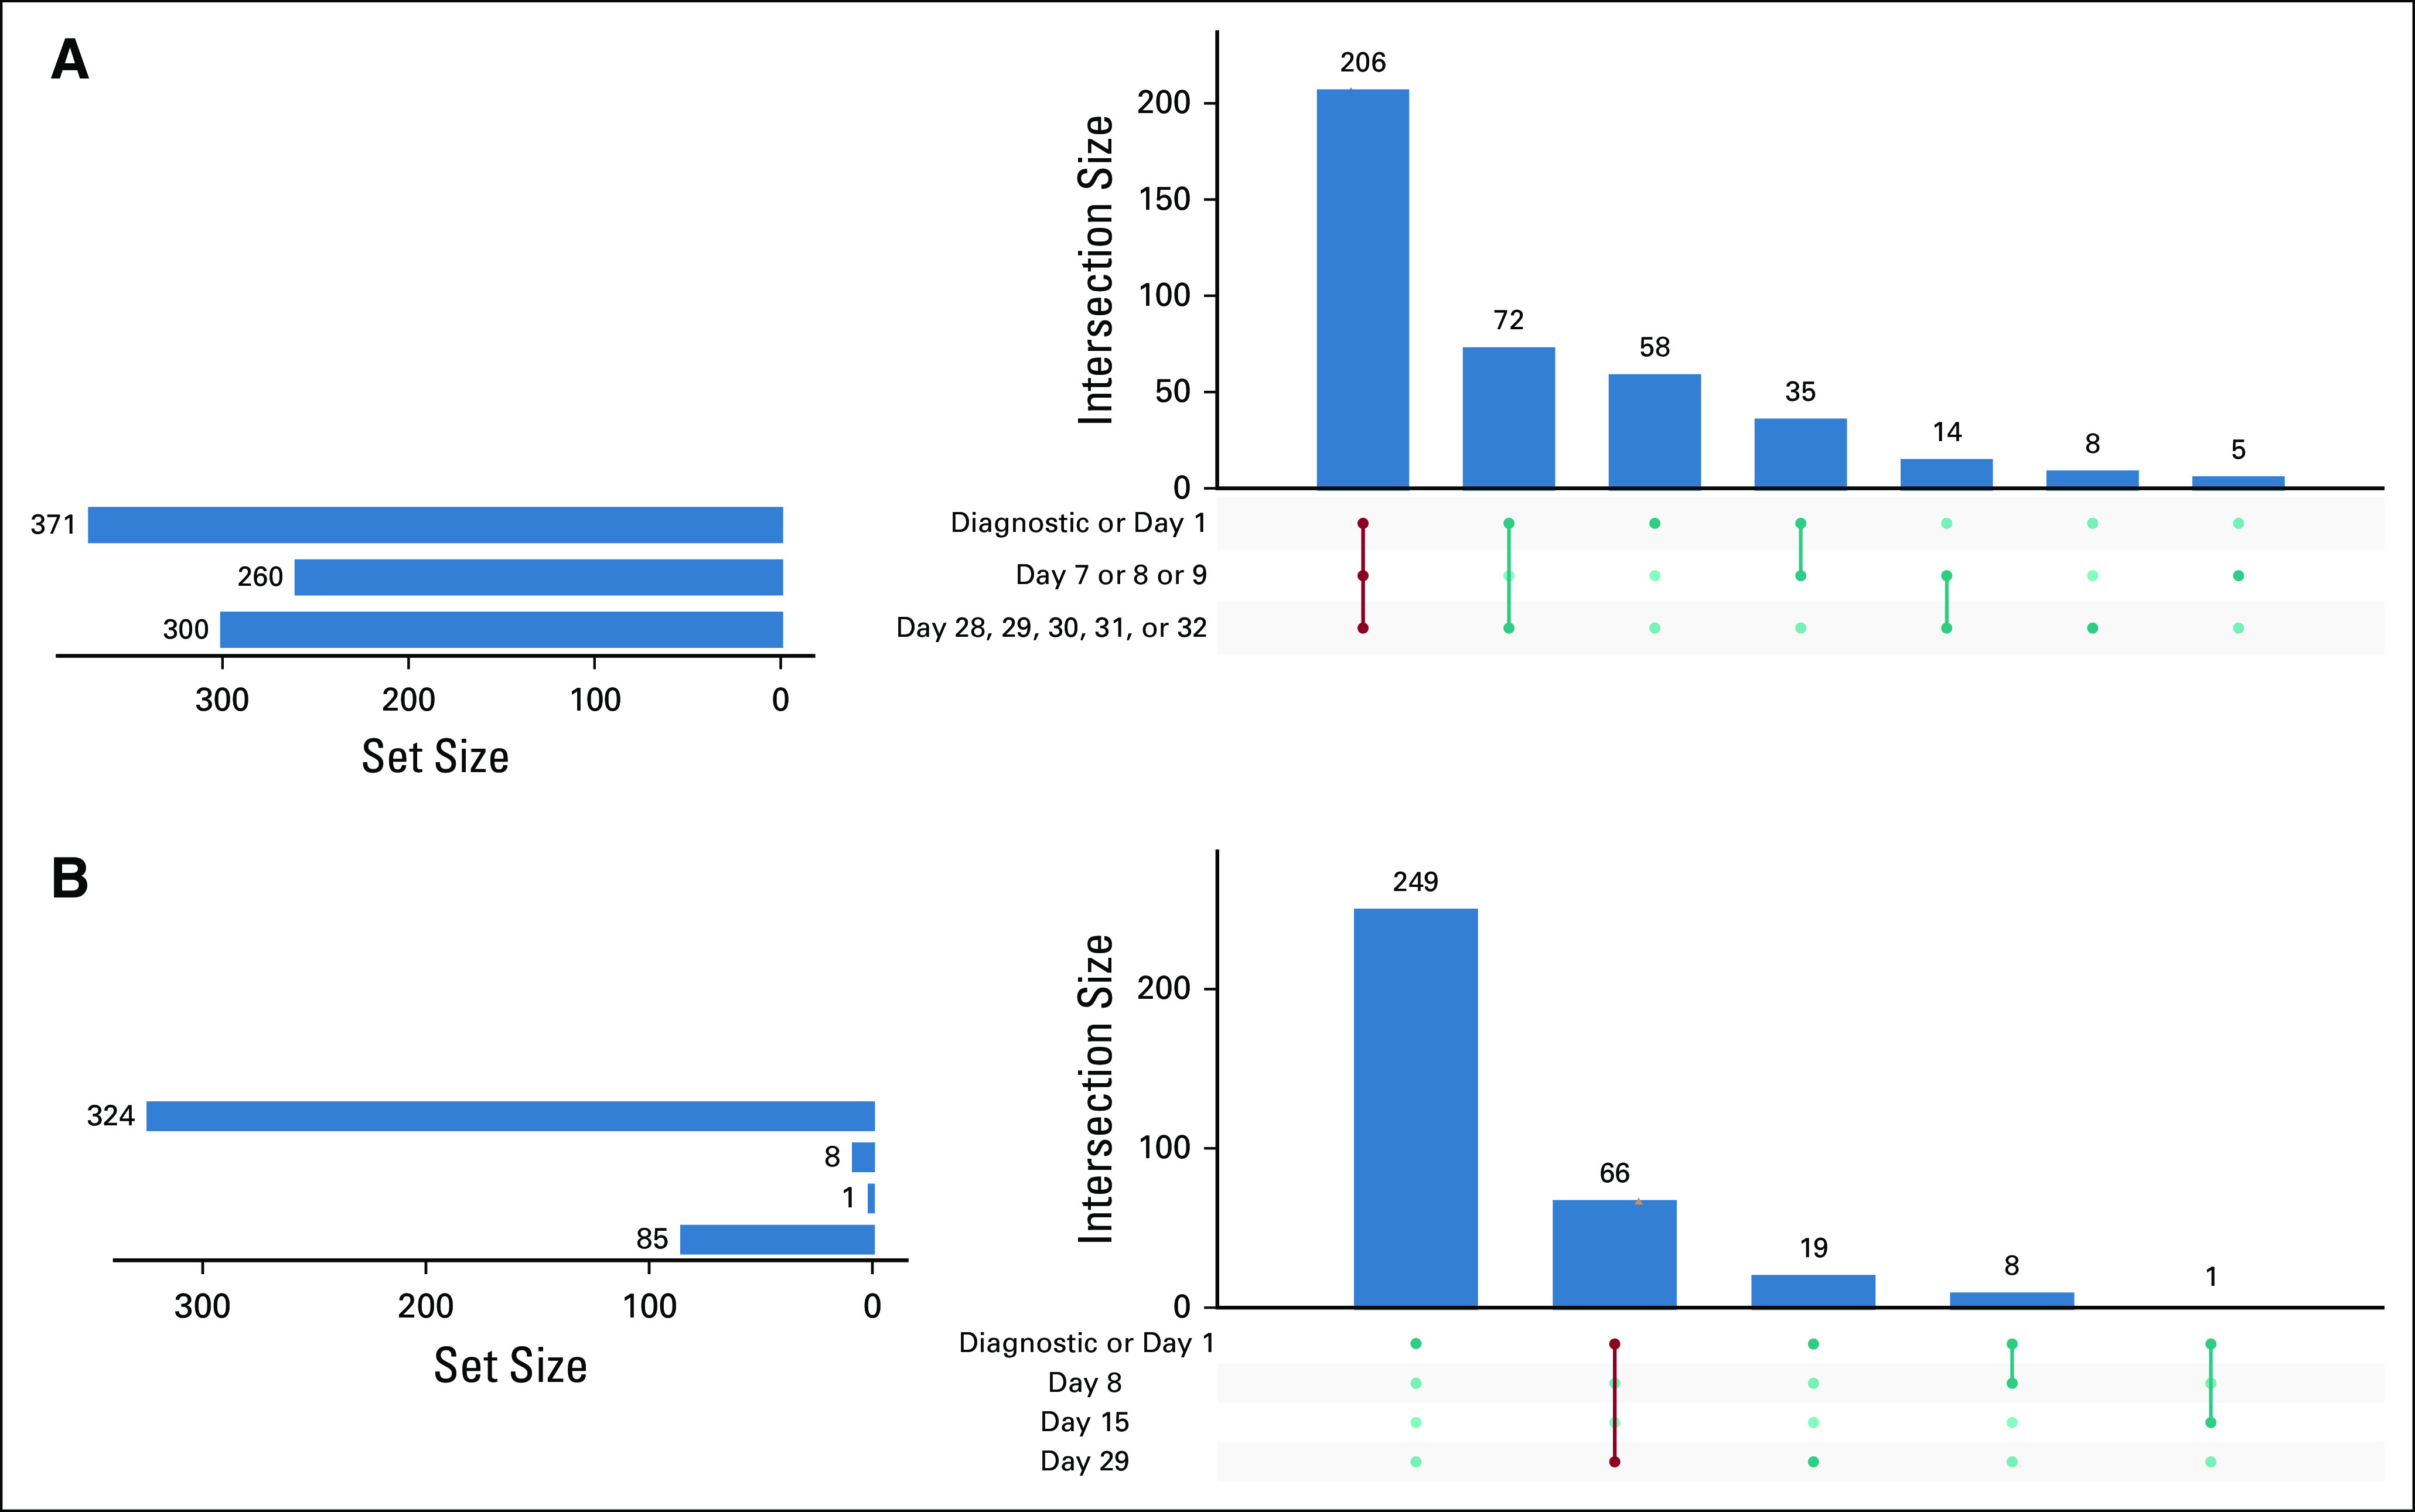
FIG 4.

UpSet graph analysis of data availability. Horizontal bars represent the sets being compared; vertical bars represent the intersections. The values in blue represent the combination of milestone events expected from the protocol. A procedure classified as diagnostic occurred within 7 days before the inferred date of initial treatment. (A) UpSet graph of LP data availability. Dates are relative to initiation of treatment. Rows represent COG milestone date ranges. (B) Bone marrow data availability. LP, lumbar puncture.
