
FIG 2.
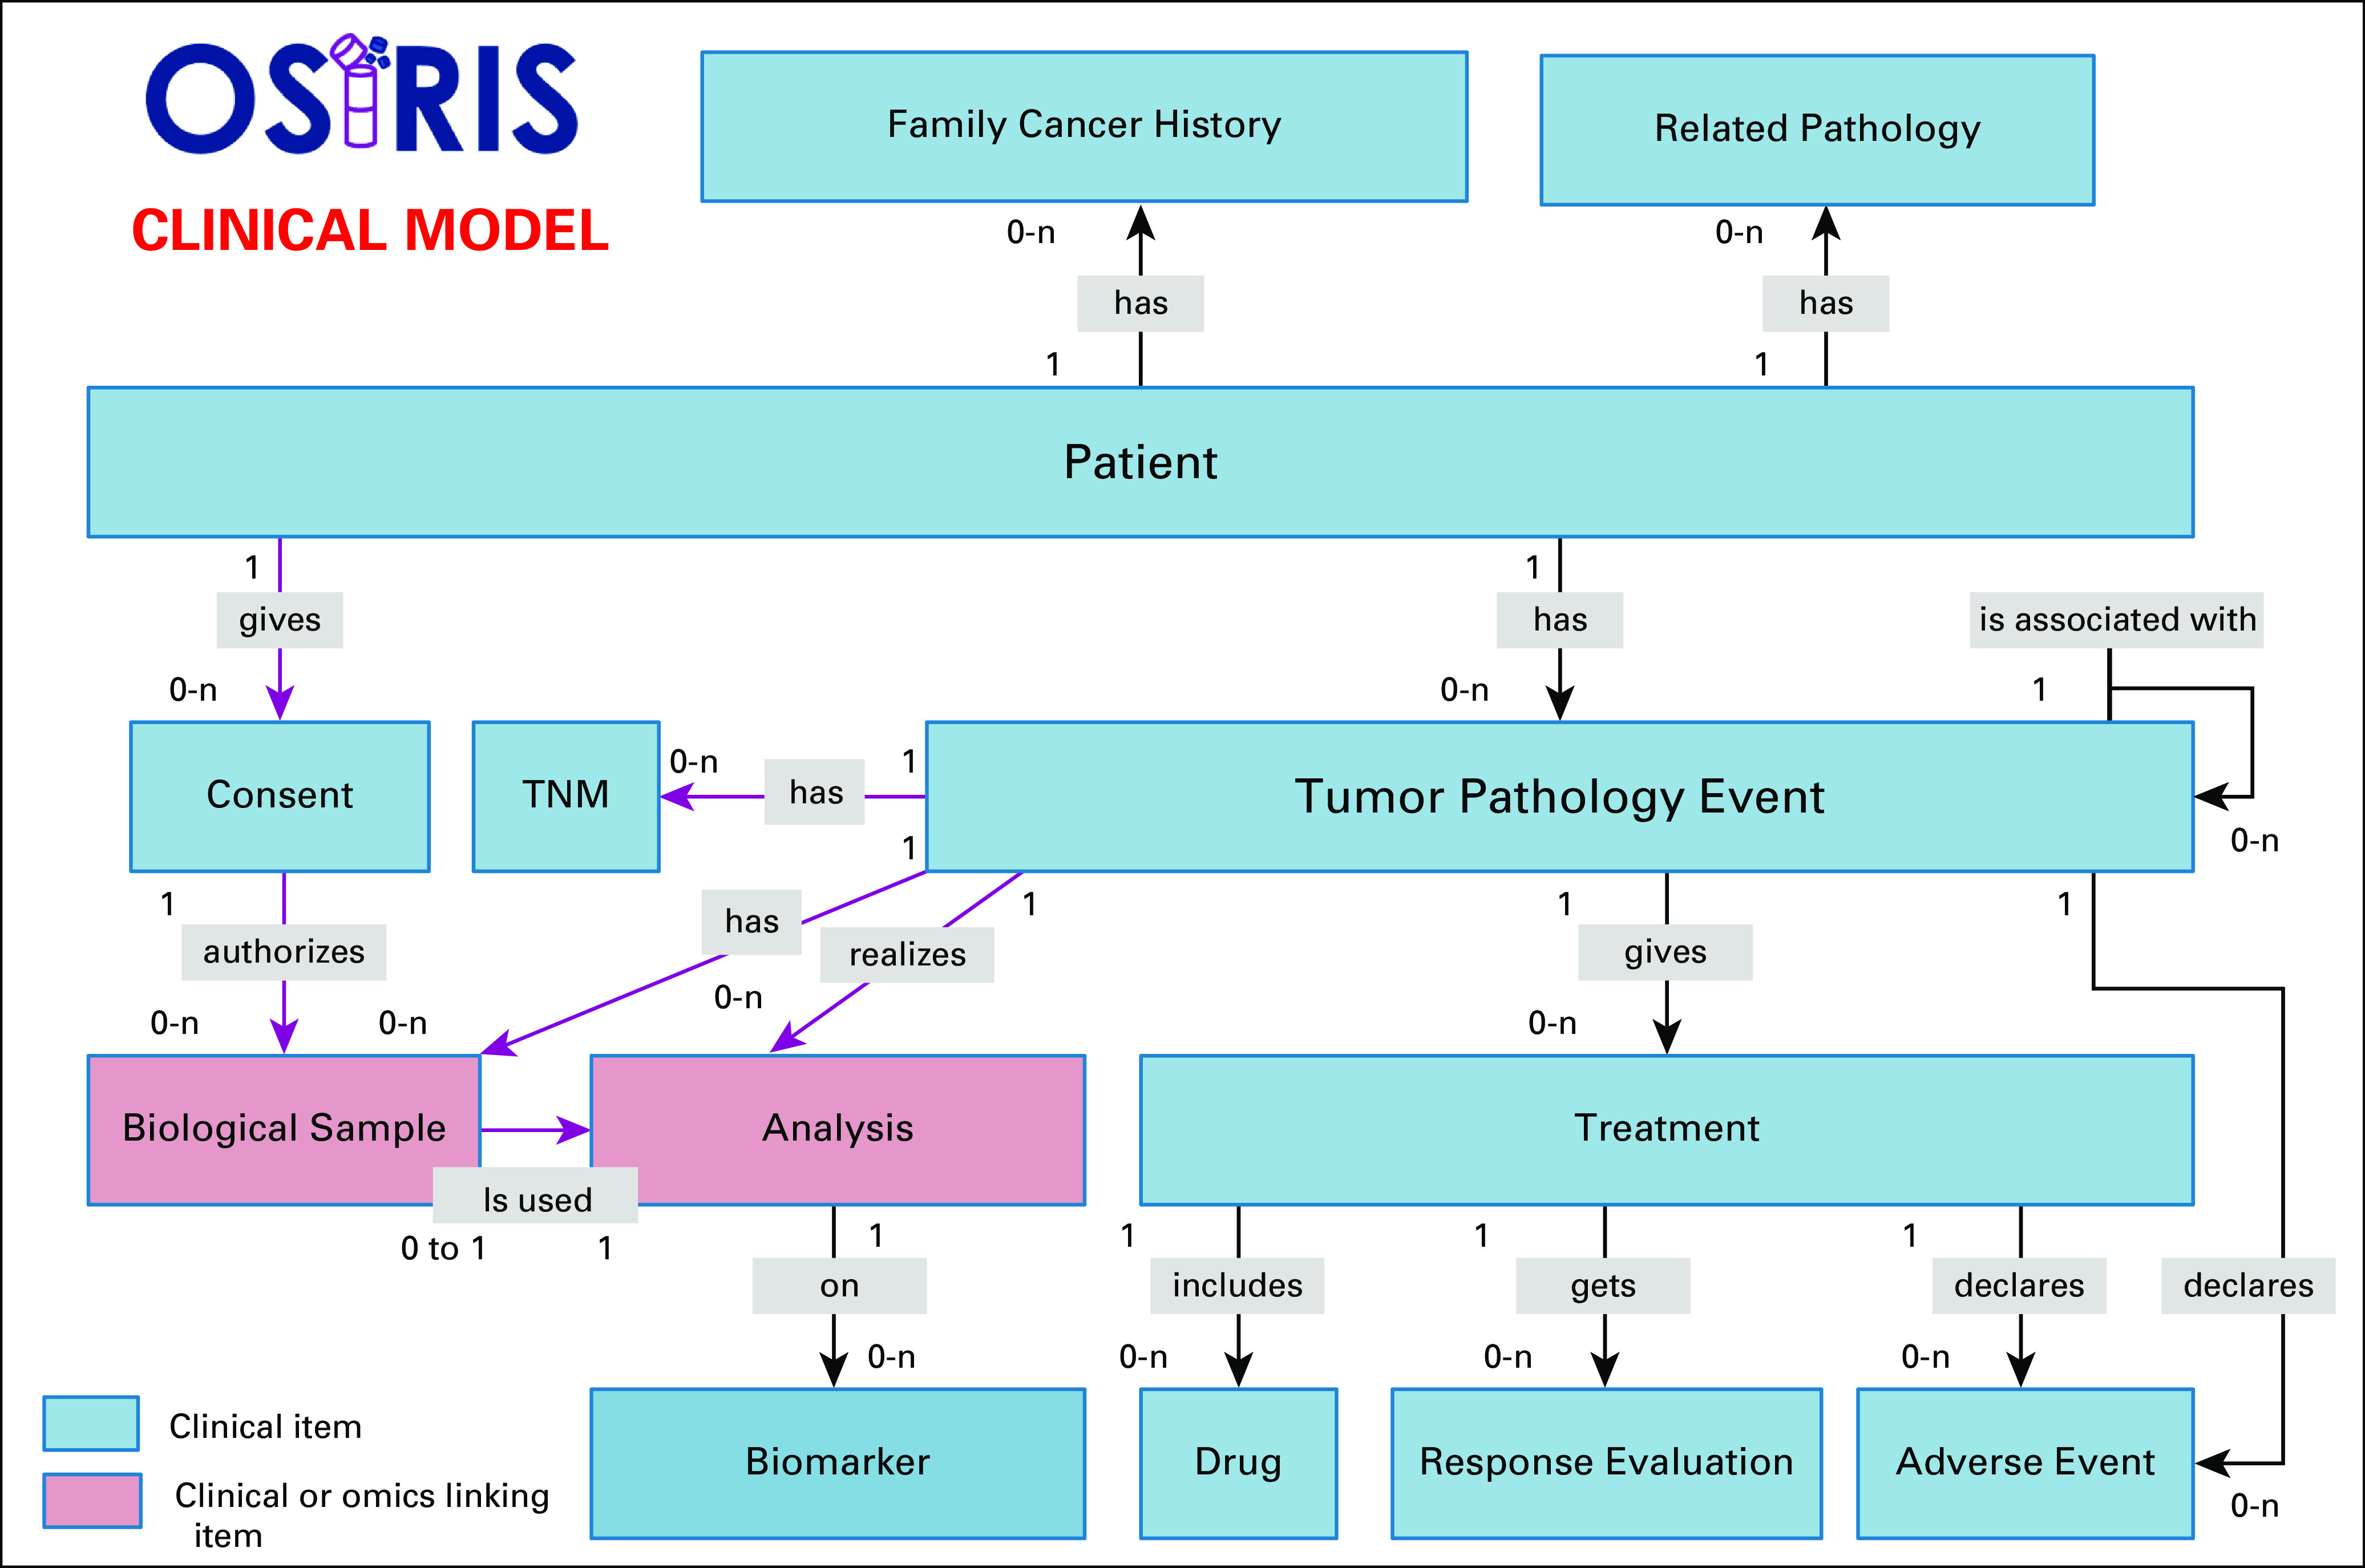
OSIRIS clinical data model. This figure shows the OSIRIS event–based clinical data model to follow the disease course longitudinally. For each event type (primary tumor and local and metastatic relapse), the response and adverse events of a treatment are associated. Moreover, any analysis carried out on a sample (imaging, omics, biology, pathologic examination) is also linked to a specific event.