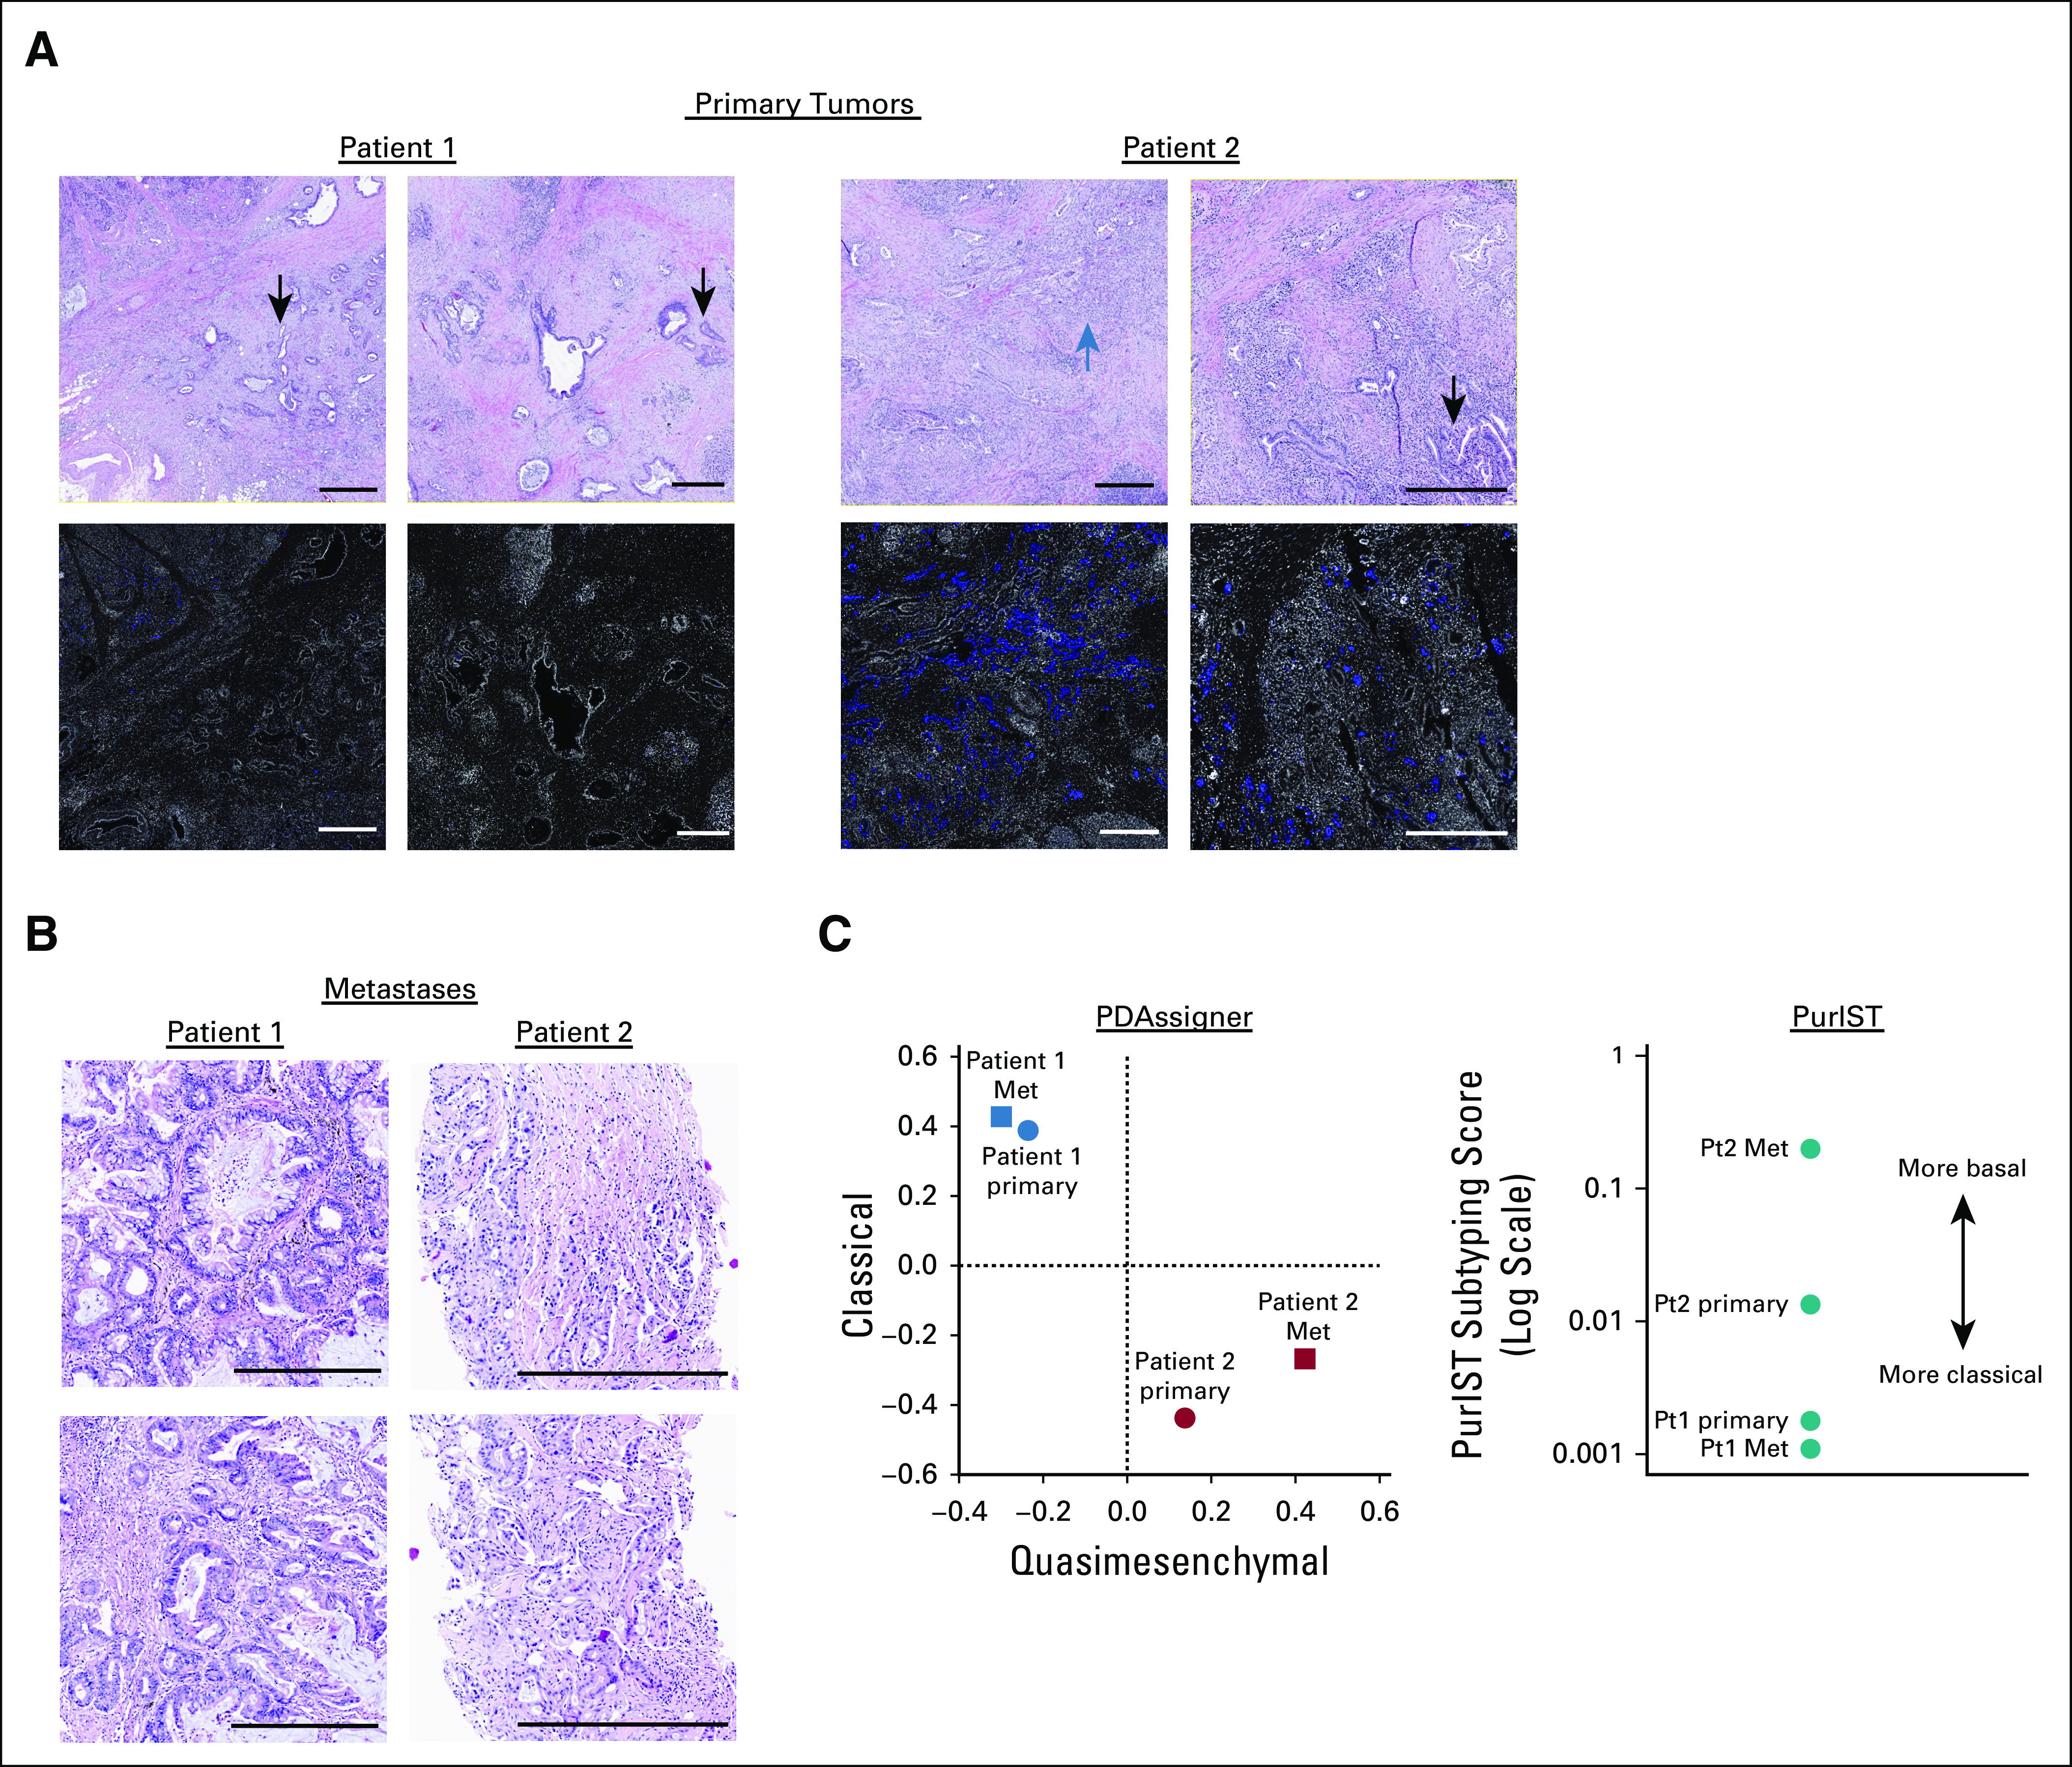
FIG 2.

PDAC subtype assignment based on histology and gene expression. (A) H&E stained sections and immunohistofluorescence for KRT5 (blue) and DAPI (white) from primary tumors. Regions of ductal or squamoid histology are indicated by black or blue arrows, respectively. Each scale bar is 0.5 mm. (B) H&E stained sections of metastases from Pt1 (lung) and Pt2 (ureter). Each scale bar is 0.5 mm. (C) PDAC subtyping of each patient's primary and metastatic tumors. Left panel: Spearman correlation coefficients for tumors from Pt1 and Pt2 compared with the published rank order of PDAssigner genes for classical (y-axis) and quasimesenchymal (x-axis) tumors. Right panel: scores from PurIST subtyping for each tumor. PDAC, pancreatic ductal adenocarcinoma.
