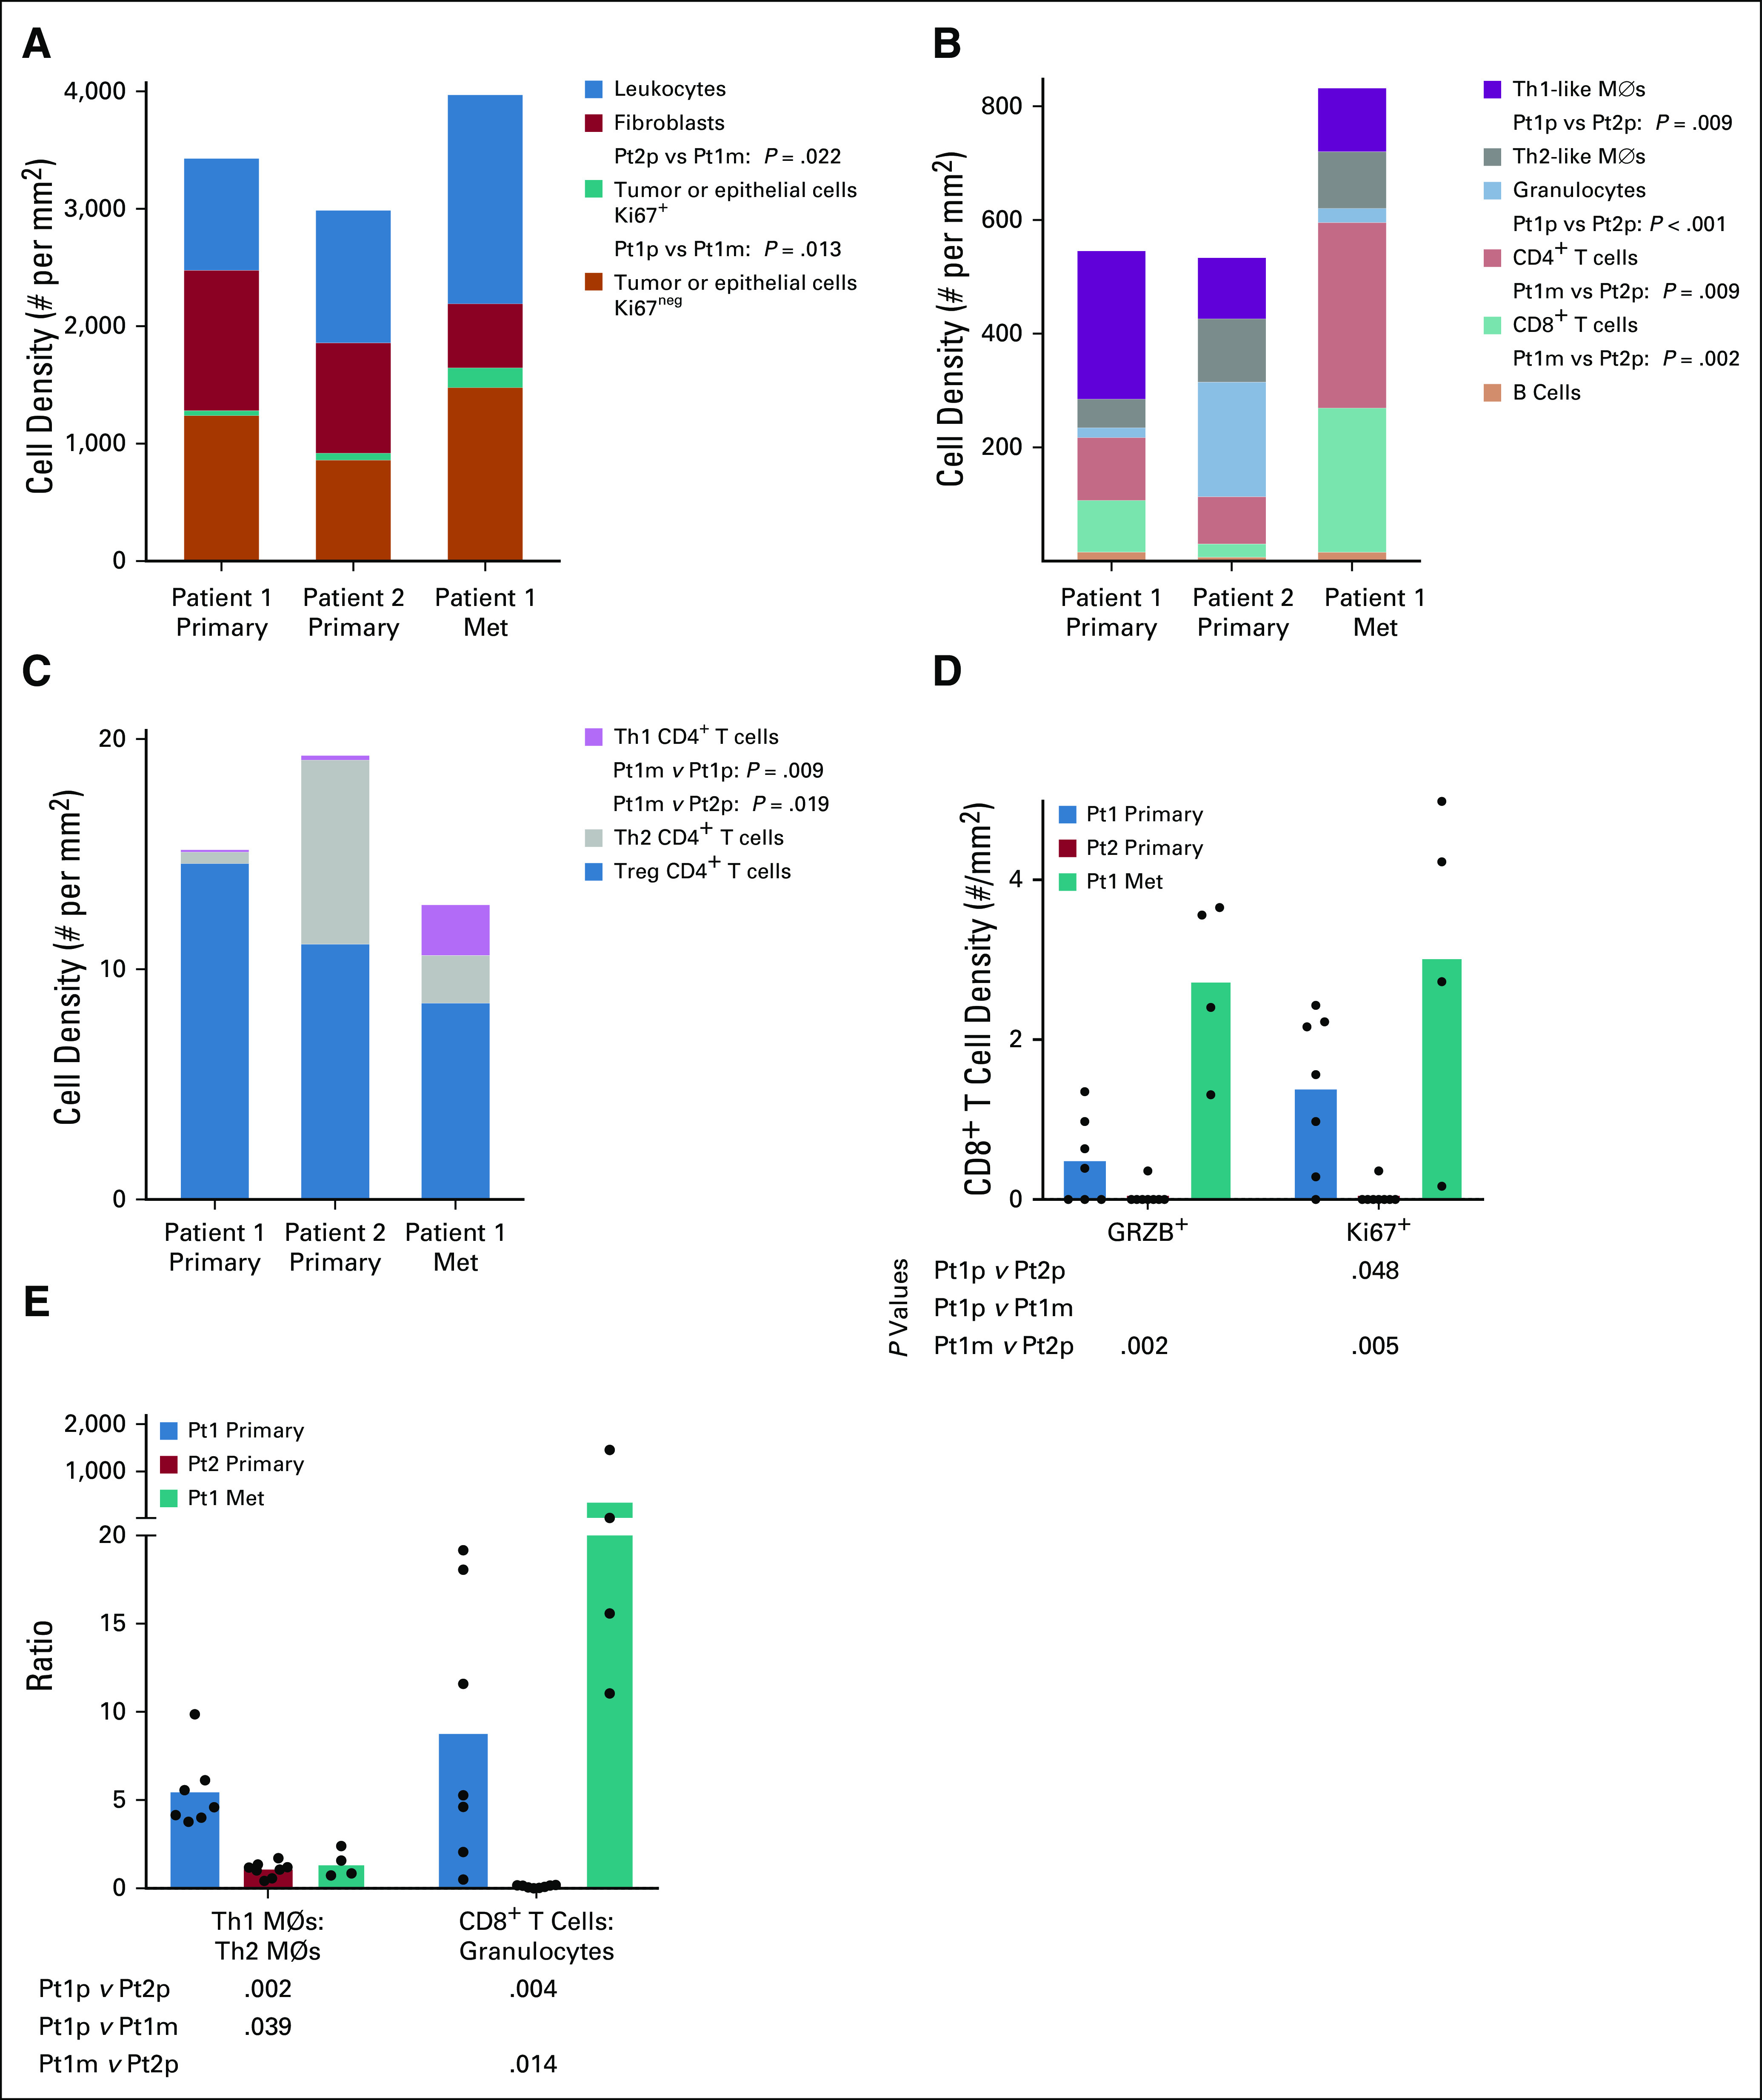
FIG 3.

(A) Mean cell density per ROI for mutually exclusive populations of Ki67+ tumor or epithelial cells, Ki67neg tumor or epithelial cells, fibroblasts, and leukocytes. (B) Mean cell density per ROI of selected leukocyte types. (C) Mean cell density per ROI of mutually exclusive CD4+ T cell subsets. (D) Densities of CD8+GRZB+ and CD8+Ki67+ T cells. (E) Relative densities of Th1-like macrophages to Th2-like macrophages and CD8+ T cells to granulocytes. For D and E, each dot represents one ROI and column heights represent the mean of ROIs. All statistical comparisons between each of the three tumors for all cell types were tested by Kruskal-Wallis one-way ANOVA. Only P values < 0.05 are given. ANOVA, analysis of variance; ROI, region of interest.
