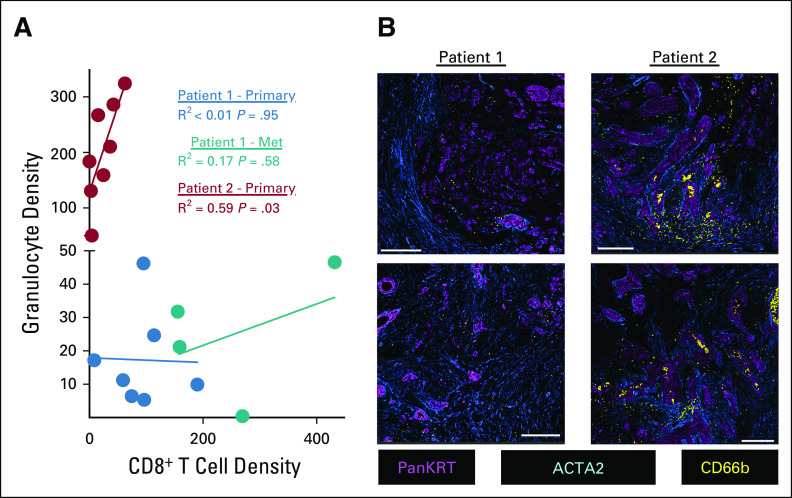
FIG 4.
(A) Correlation between the densities of CD8+ T cells and granulocytes. Each dot represents one ROI. R2 and P values are based on a simple linear regression. (B) Granulocytes (CD66b+), tumor cells (PanKRT+), and fibroblasts (ACTA2+) in primary tumors from each patient. Scale bars represent 250 μm. ROI, region of interest.

