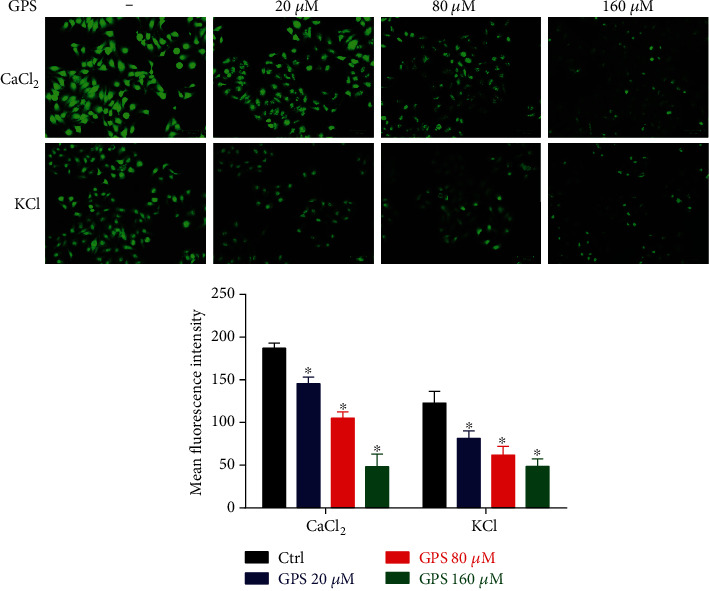
Figure 5.

Effects of GPS (20, 80, and 160 μM) on the fluorescence intensity of vascular smooth muscle A7r5 cells stimulated using 1 μM PE-2.5 mM CaCl2 in Ca2+-free Krebs solution or 100 mM KCl in Krebs solution. Images were taken using laser confocal microscopy. Scale bar: 50 μm. Green fluorescence intensities represent the intracellular calcium concentration ([Ca2+]in) levels. Data are presented as mean ± SEM (n = 6). ∗p < 0.05 compared to the control group.
