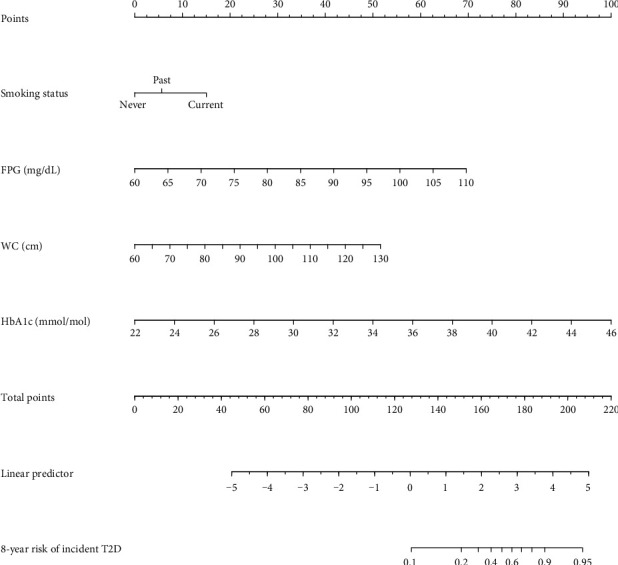
Figure 4.

Nomogram for predicting the 8-year risk of T2D in adults with NAFLD. To use the nomogram, an individual patient's value is located on each variable axis, and a line is drawn upward to determine the number of points received for each variable value. The scores for all variables are then added to obtain the total score, and a vertical line is drawn from the total-points row to estimate the 8-year risk of T2D in adults with NAFLD at the lower line of the nomogram.
