Figure 4.

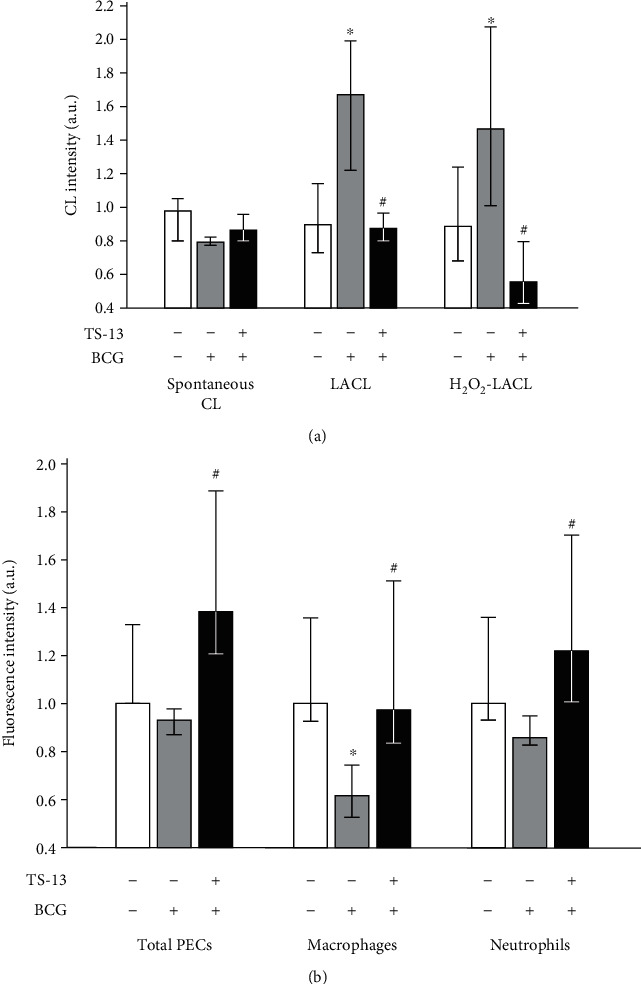
ROS generation in liver ((a) homogenate CL) and by peritoneal exudate cells ((b) DCF-dependent PMA-stimulated fluorescence) 30 days after BCG infection. Open bar indicates negative control (saline-infected mice receiving water), gray bar indicates positive control (BCG-infected mice receiving water), and solid bar indicates BCG-infected mice receiving TS-13 in drinking water. ∗p < 0.05 compared with negative control; #p < 0.05 compared with positive control.
