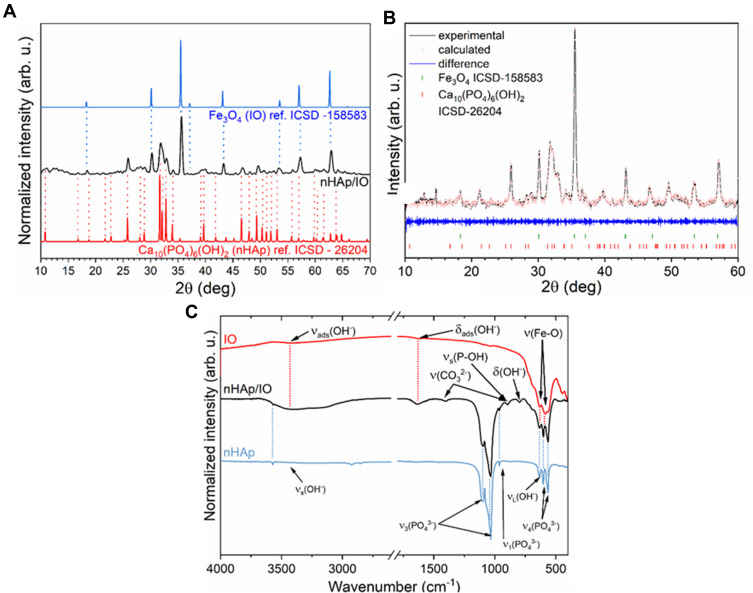
Figure 1.
XRD pattern of the obtained nHAp/IO together with the corresponding references (A). Result of the Rietveld analysis (black line– XRPD pattern; red points—fitted diffraction; blue—differential pattern; red and green—positions of reference phase peaks) (B). FT-IR spectrum of the obtained nHAp/IO (black line) with the indication of characteristic bands originating from IO (red line) and nHAp (blue line) (C).

