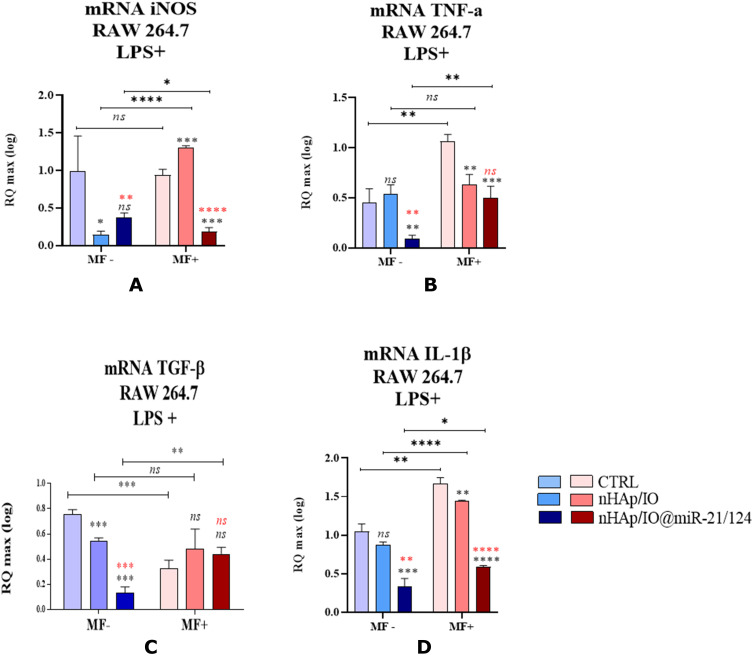
Figure 12.
The impact of the nanocomposites alone and in combination with the miR21/124 in the presence of LPS in the condition of MF on the expression of genes associated with inflammatory markers iNOS (A), TNFα (B), TGF-β (C), IL-1β (D) in RAW 264.7 cell line. Significant differences are indicated as follows (*p<0,005, **p<0,001,***p<0,001 and ****p<0.0001) and non-significant are marked as ns. The comparisons between groups are marked with brackets. The black symbols refer to the differences between CTRL and nHAp/IO groups, while red symbols are for nHAp/IO and nHAp/IO@miR-21/124 groups.

