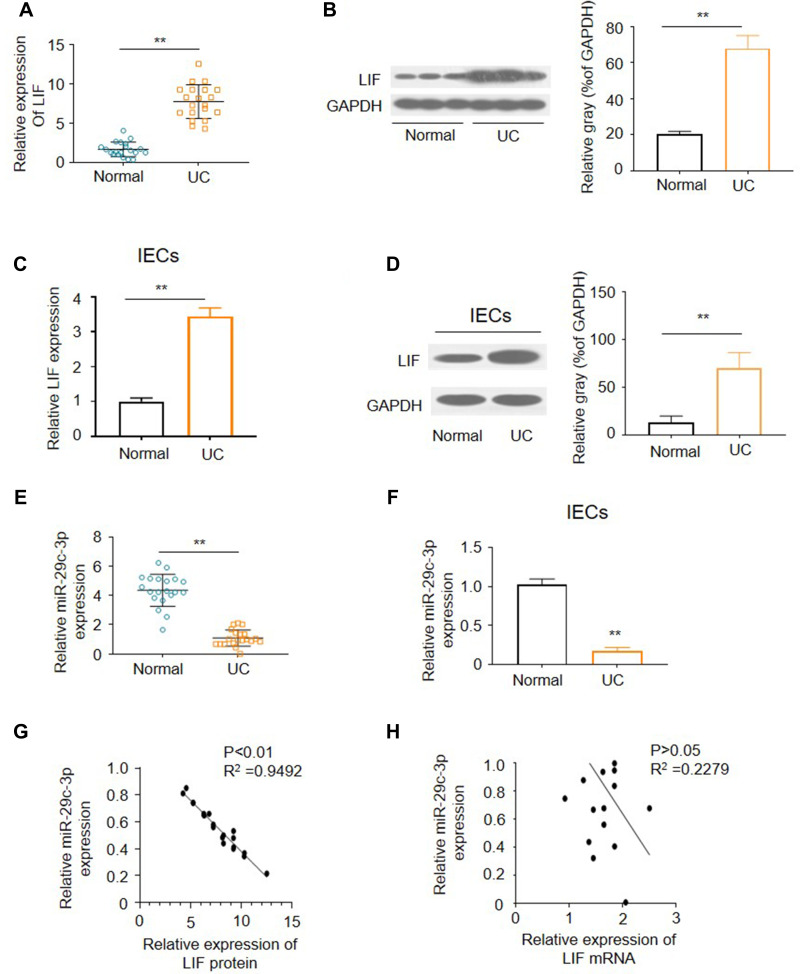
Figure 1.
The expression of miR-29c-3p and LIF in UC tissues and IECs. (A) The mRNA levels of LIF in UC and normal tissues. (B) Representative Western blots and densitometric quantitative analysis of LIF proteins levels in UC and normal tissues. (C) The mRNA levels of LIF in primary IECs of UC and normal colon. (D) Representative Western blots and densitometric quantitative analysis of LIF protein levels in IECs of UC and normal colon. (E) The expression of miR-29c-3p in UC and normal tissues. (F) The expression of miR-29c-3p in primary IECs of UC and normal colon. (G) Pearson’s correlation analysis of the expression levels of miR-29c-3p and LIF protein. (H) Pearson’s correlation analysis of the expression levels of miR-29c-3p and LIF mRNA. **P<0.01 versus normal group.

