
Figure 2. Inhibition of TCF transcriptional activity.
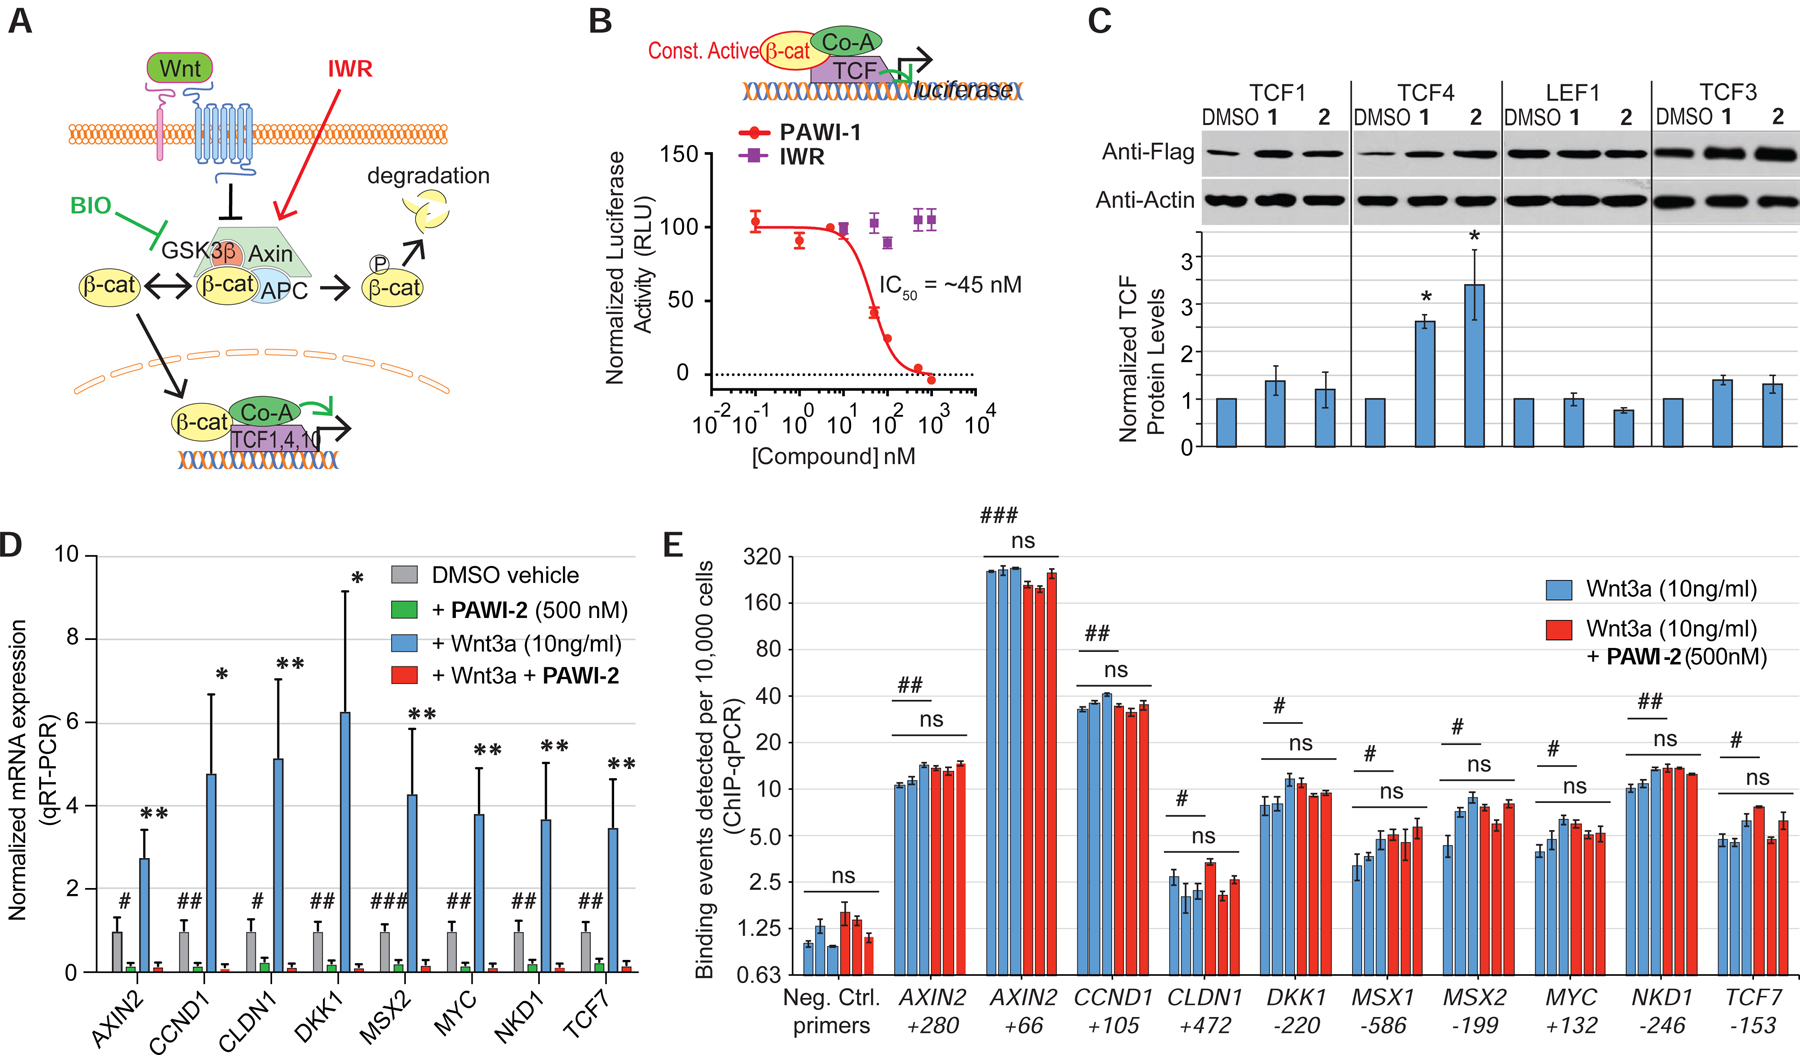
A) Schematic depicting the core canonical Wnt signaling cascade.
B) Scheme depicts β-catenin luciferase assay. Effect of PAWI-1 and an IWR-1 analogue on a constitutively active mutant form of β-catenin protein expressed in HEK29T cells together with a TCF-luciferase reporter gene. PAWI-1 IC50 = 45.5 nM. Error bars represent s.e.m (n=3).
C) Effect of PAWI-1 and PAWI-2 on TCF proteins. HEK293T cells were transfected to express flag-tagged TCF proteins and treated with either DMSO vehicle or compounds (500 nM) for 24 hours. Western blotting shows the levels of the TCF proteins. Error bars represent s.e.m (n=3, TCF1, TCF4, LEF1; n=4, TCF3).
D) RT-qPCR showing gene expression of canonical Wnt-inducible genes in HEK293T cells at following treatment with DMSO (vehicle for PAWI-2), PAWI-2 (500 nM), recombinant Wnt3a (10 ng/ml), and Wnt3a plus PAWI-2. Data were normalized to GAPDH expression and DMSO vehicle. Error bars represent s.e.m. (n=5).
E) ChIP PCR of promoter regions of Wnt/β-catenin target genes in HEK293T cells treated as in panel D. The centers of the amplified regions are indicated. 3 biological replicates (blue and red bars). Error bars represent s.e.m. (n=3 technical replicates).
ns indicates not statistically significant; *,#; **,## and ***,### indicate p-values of <0.05, <0.01 and <0.001, respectively (T-test of biological replicates). In panel D, symbols indicate comparisons of PAWI-2-treated to respective DMSO vehicle (#) or to Wnt3a-induced (*) levels. In panel E, symbols indicate comparisons of specific TCF4 binding sites versus negative control sites (#) or to Wnt3a versus respective Wnt3a + PAWI-2 treated (ns).