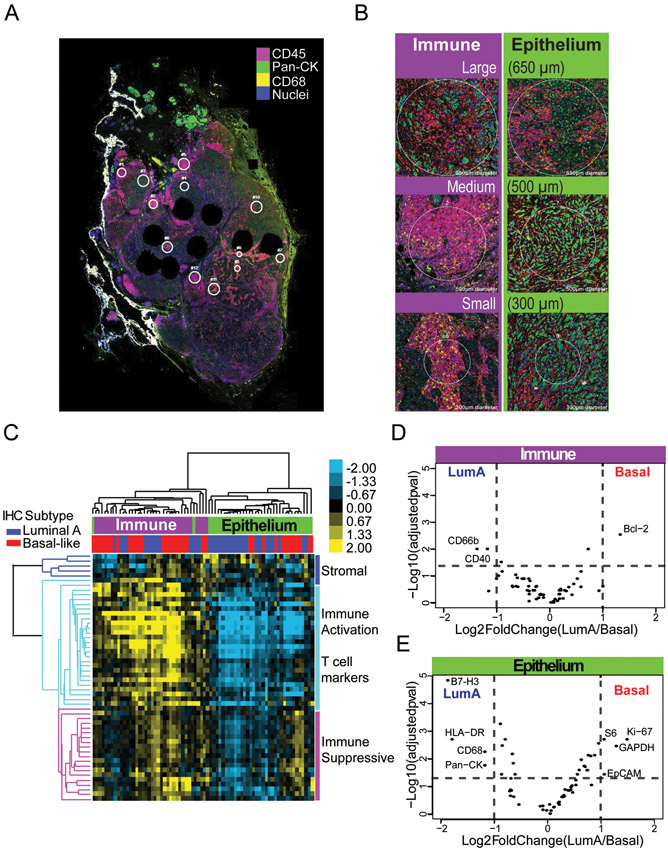
Figure 1). Subtype immune marker heterogeneity is apparent in epithelium-enriched regions versus immune hot spots.
(a) Representative whole tumor slide stained with CD45 (red), CD68 (yellow), and pan-Cytokeratin (green), in addition to 61 oligo-conjugated antibodies for immune and tumor cell markers. (b) Regions of interest (ROIs) were selected based on cellularity, large (650 μm), medium (500 μm), and small (300 μm). (c) Heatmap of protein expression for whole slide dataset with immunohistochemistry (IHC) subtype and cellularity labeled. Protein class clusters are denoted by colored bars and branches, with dark blue denoting stromal proteins, light blue denoting T cell and immune activation markers, and pink denoting immunosuppressive markers. (d-e) Volcano plots for Basal-like vs Luminal A subtypes were run separately for D) immune hot spot ROIs and E) epithelium-enriched ROIs. Data points are represented as black dots with annotation for markers with q < 0.05 and fold change > 2. Dashed lines indicate the cut off q < 0.05 and fold change < 2.

