
Fig. 4. Translational profiling methods.
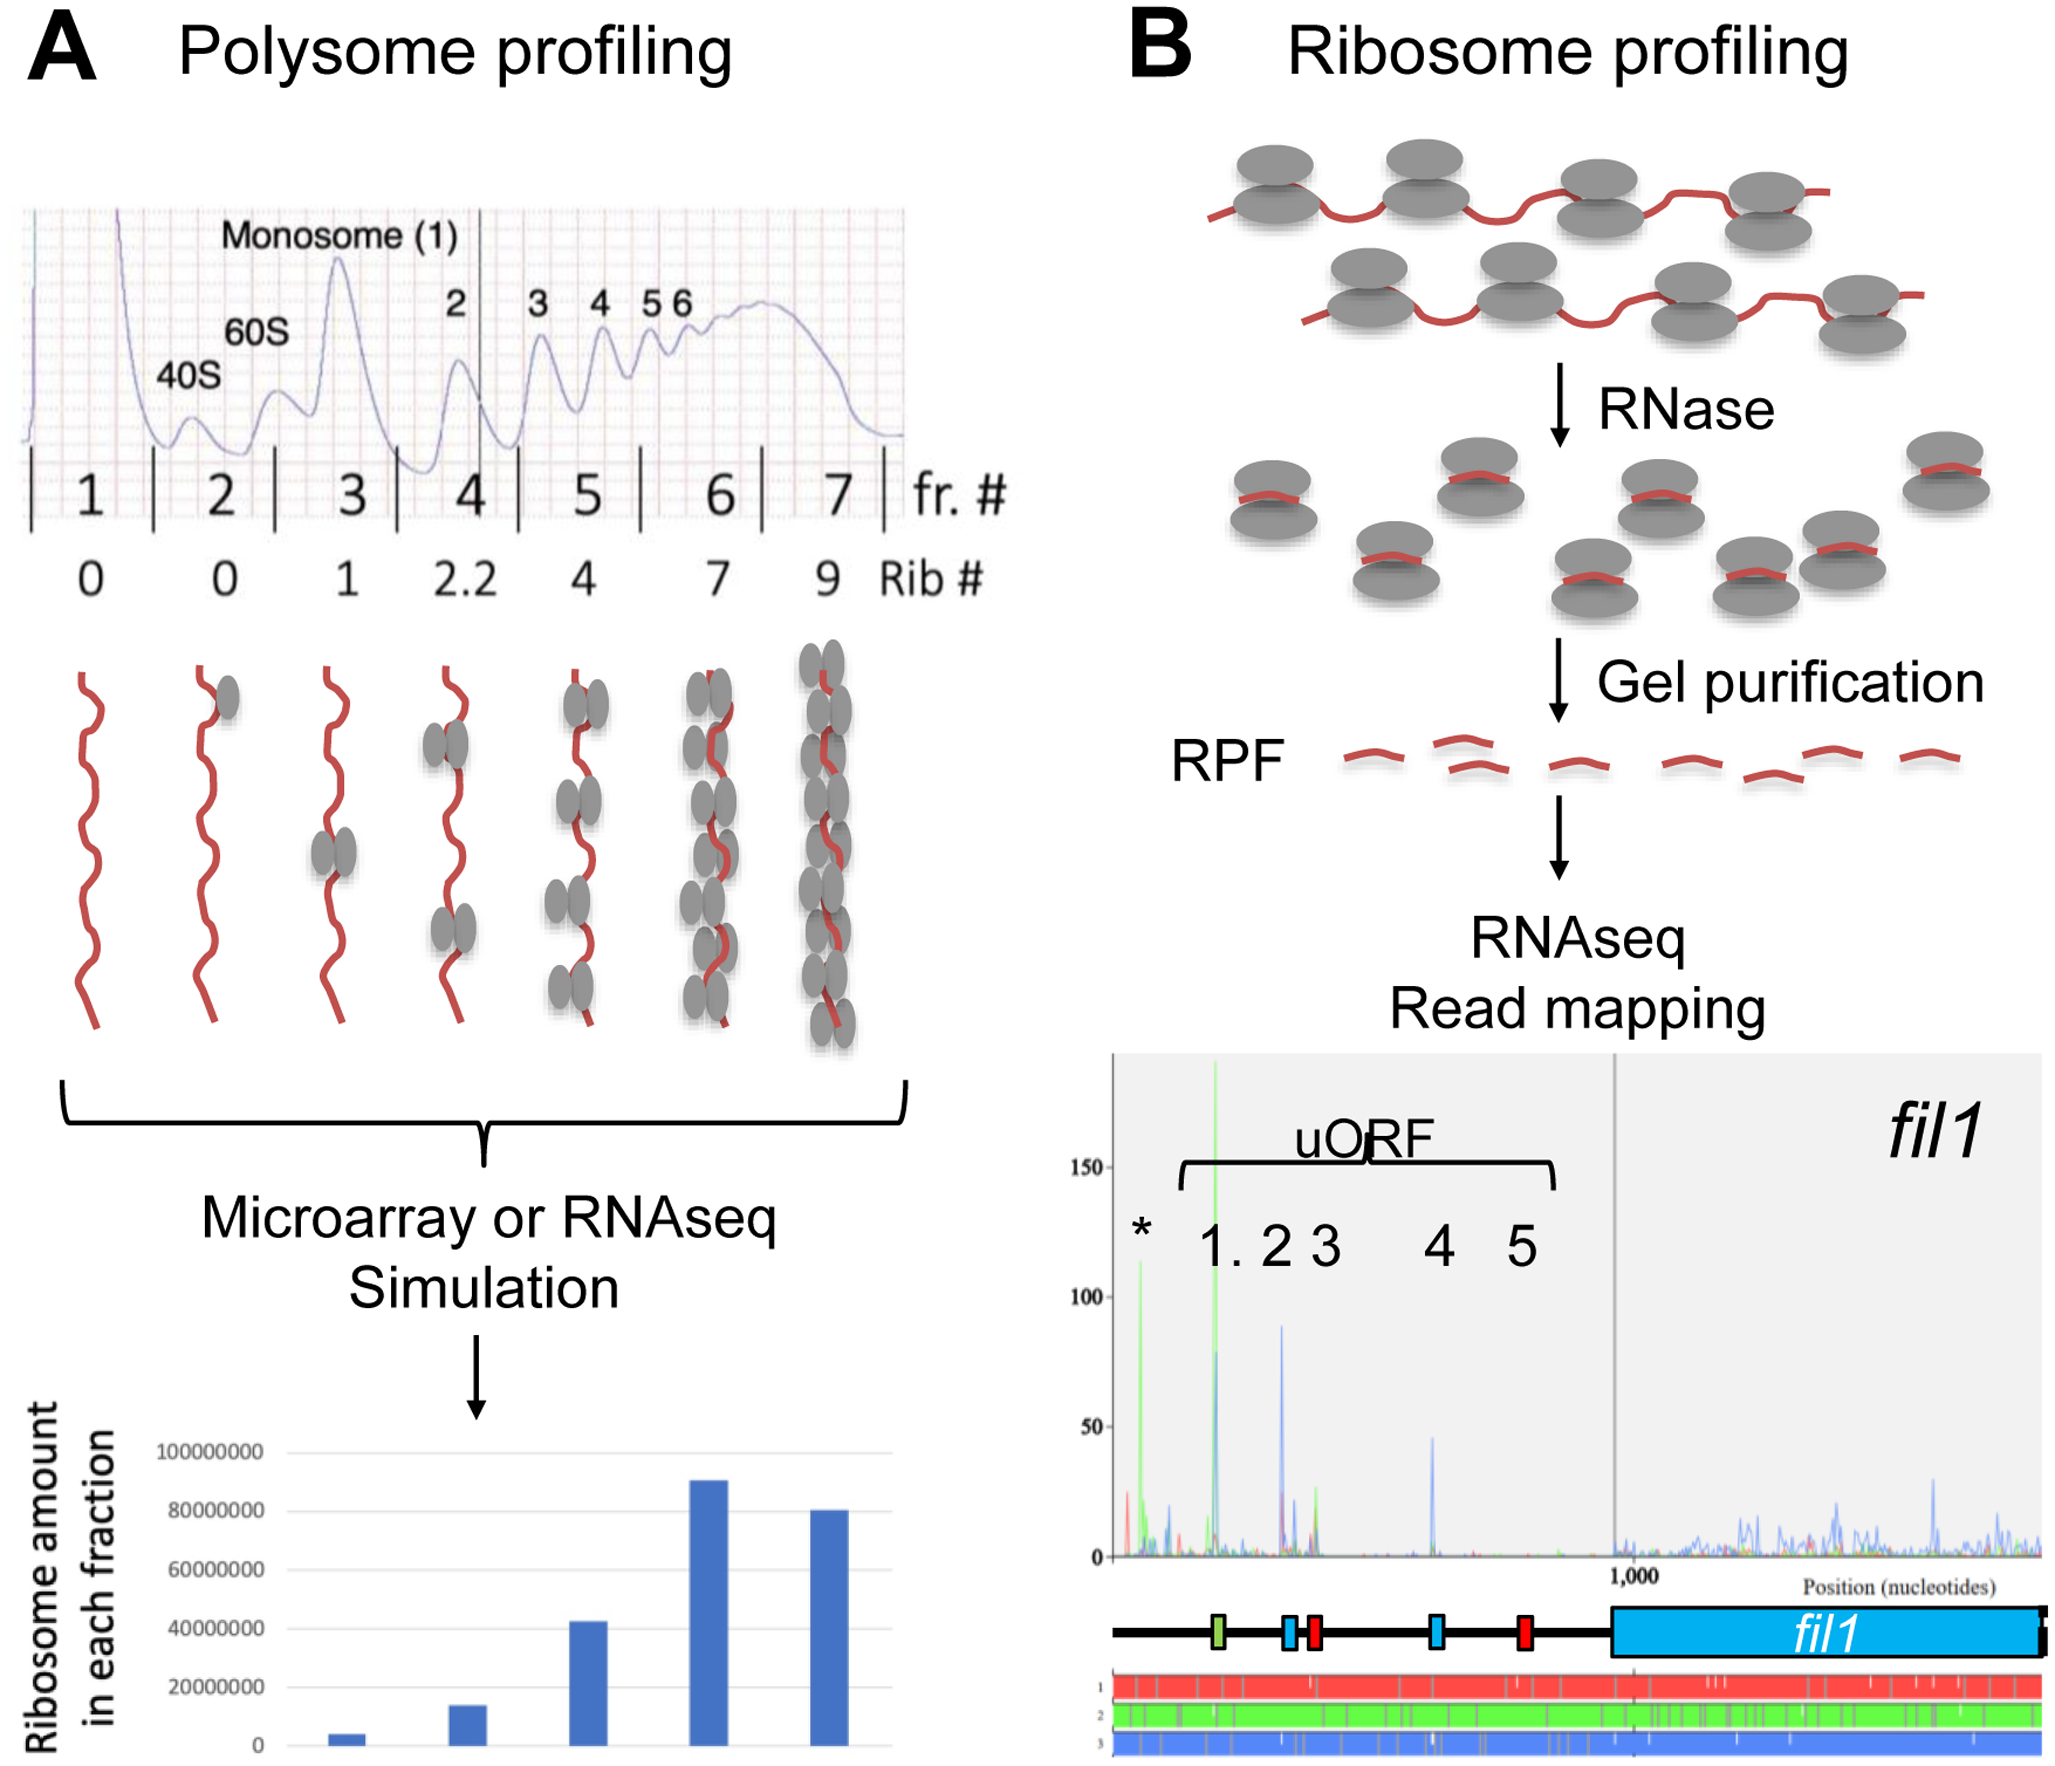
(A) Polysome profiling. Top indicates a typical A254 profile of polysomes. Bars indicate boundaries of fractions taken with their numbers indicated in-between. Numbers below the graph indicates the number of translating ribosomes bound to mRNAs in each fraction. Schematics below depicts mRNA (brown line) loaded with different numbers of ribosomes (depicted as ovals as in Fig. 1A) found in each fraction. RNA from each fraction is quantified with DNA microarray (Microarray) or sequenced (RNAseq). The graph below shows the simulated ribosome mass in each fraction using the ribosome numbers as assigned above and mRNA abundance values obtained by microarray hybridization. (B) Ribosome profiling. The flow chart depicts the method of generation and sequencing of ribosome-protected mRNA fragments (RPF, short brown lines) from polysomes (the schematics on top, depicted as in panel A). Bottom graph presents an example of RPF read mapping and shows the protection patters in the 5’ half of fil1 mRNA. Plots are color-coded by three reading frames presented on bottom. Schematics in the middle represent uORF structures and the main CDS also color-coded similarly. Asterisk, the green peak located before uORF1 represents a possible additional uORF initiated by a CUG codon (Duncan et al., 2018). Adapted from Fig. S6A of (Chikashige et al., 2020).