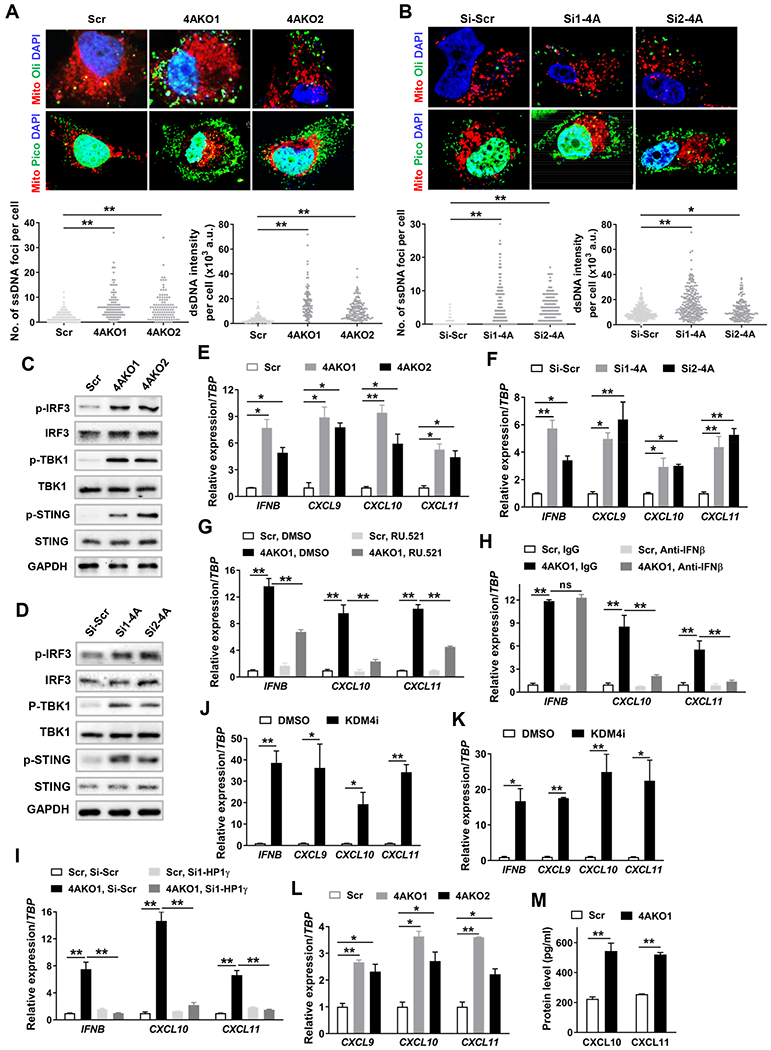
Figure 4. KDM4A Inhibition Promotes Th1-type Chemokine Expression by Activation of cGAS-STING Signaling.

(A and B) Representative confocal images showing cytosolic DNA and mitochondria (red) as well as nuclei (blue), and quantification of cytosolic ssDNA (lower left panel) and dsDNA (lower right panel) in Scr and 4AKO SCC23 cells (A) and in SCC1 cells transfected with Si-Scr, Si1-4A and Si2-4A (B). Scale bar, 10 μm. Values are mean ± SD from the pool of three independent experiments. *p < 0.05, **p < 0.01 by one-way ANOVA.
(C and D) Western blot analysis of phosphorylated and total IRF3, TBK1 and STING in Scr and 4AKO SCC23 cells (C) and in Si-Scr and Si-4A SCC1 cells (D).
(E and F) Gene expression analysis of IFNB and Th1-type chemokines (CXCL9, CXCL10, CXCL11) in Scr and 4AKO SCC23 cells (E) and in Si-Scr and Si-4A SCC1 cells (F). Values are mean ±SD from three independent experiments. *p<0.05 and **p<0.01 by one-way ANOVA.
(G) Gene expression analysis of IFNB, CXCL10 and CXCL11 in both Scr and 4AKO1 SCC23 cells treated with either DMSO or 10 μM RU.521. Values are mean ± SD from three independent experiments. **p<0.01 by two-way ANOVA.
(H) Gene expression analysis of IFNB, CXCL10 and CXCL11 in both Scr and 4AKO1 SCC23 cells treated with either IgG or anti-IFNβ. Values are mean ± SD from three independent experiments. **p<0.01 and ns, not significant by two-way ANOVA.
(I) qRT-PCR analysis of IFNB, CXCL10 and CXCL11 in both Scr and 4AKO1 SCC23 cells transfected with either Si-Scr or Si1-HP1γ. Values are mean ± SD from three independent experiments. **p<0.01 by two-way ANOVA.
(J and K) Gene expression analysis of IFNB and Th1-type chemokines in SCC23 cells (J) and SCC1 cells (K). Values are mean ±SD from three independent experiments. *p<0.05 and **p<0.01 by Student’s t test.
(L) Gene expression analysis of IFNγ-induced Th1-type chemokines in Scr and 4AKO SCC23 cells. Values are mean ± SD from three independent experiments. *p<0.05 and **p<0.01 by one-way ANOVA.
(M) Analysis of CXCL10 and CXCL11 protein levels with ELISA assay in IFNγ-treated Scr and 4AKO1 SCC23 cells. Values are mean ± SD from three independent experiments. **p<0.01 by Student’s t test.
Also see Figure S3
