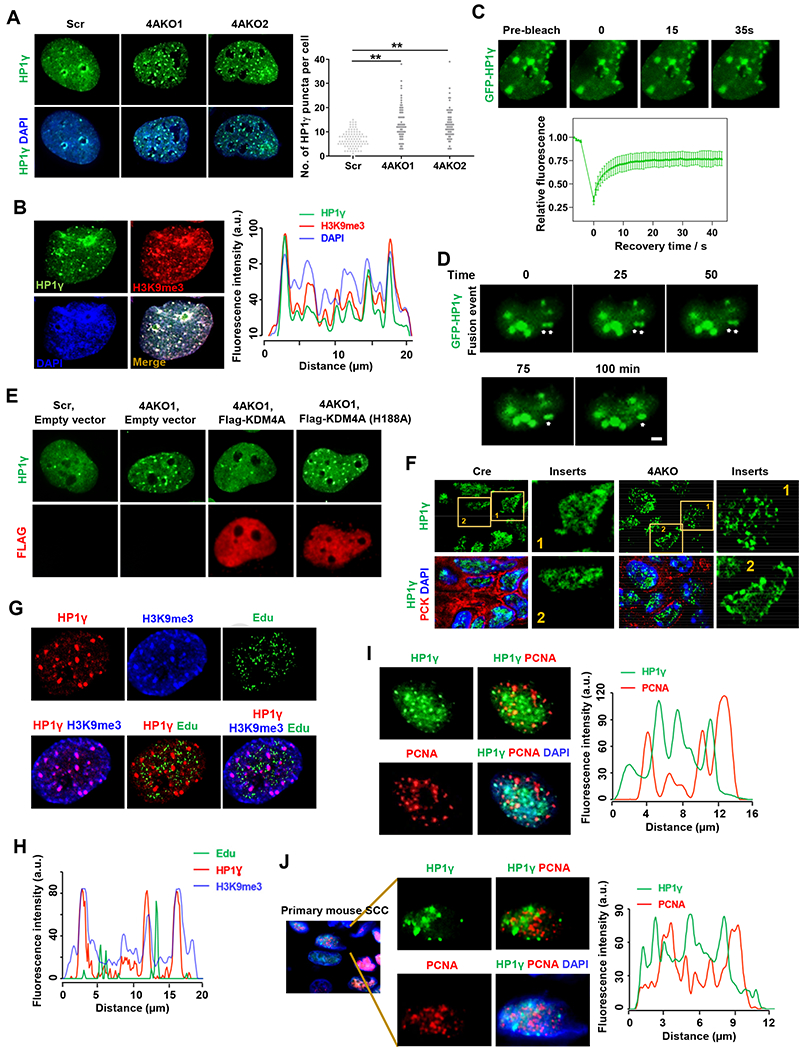
Figure 5. KDM4A Loss Increases Liquid-like HP1γ puncta in SCC cells.

(A) Immunofluorescence staining of HP1γ and DAPI, and quantification of HP1γ puncta in Scr and 4AKO SCC23 cells. Values showed by mean ± SD were pooled from three independent experiments. Scale bar, 5 μm. **p<0.01 by one-way ANOVA.
(B) Representative immunofluorescence images of HP1γ (green), H3K9me3 (red), DAPI (blue) and their merge, and localization analysis for HP1γ puncta, H3K9me3 and DAPI along the indicated line scan (white arrow) in 4AKO SCC23 cells. Scale bar, 2 μm.
(C) Representative fluorescence images and quantitative analysis of fluorescence recovery after photobleaching (FRAP) on GFP-HP1γ puncta in 4AKO SCC23 cells. Arrowheads indicated the puncta that were analyzed by FRAP assay. Scale bar, 2 μm. Values were shown by mean ± SD (n=12, GFP-HP1γ puncta) from one representative of three independent experiments.
(D) Live-cell imaging of 4AKO SCC23 cells expressing GFP-HP1γ. The arrows indicate two HP1γ puncta that are fusing over time. Three independent experiments show similar results. Scale bar, 5 γm.
(E) Representative immunofluorescence staining of HP1γ and FLAG in Scr and 4AKO SCC23 cells transfected with empty or Flag-KDM4A expression vectors. Scale bar, 5 μm.
(F) Representative confocal fluorescence images showing HP1γ (green), H3K9me3 (red) and DAPI (blue) in primary SCCs from both control (Cre) and 4AKO mice. Enlarged images were shown in the inserts. Scale bar, 2 μm. Scale bar in the insert, 1 μm.
(G) Representative confocal fluorescence images of HP1γ (red), H3K9me3 (blue), Edu (green) and their merges in 4AKO SCC23 cells. Scale bar, 2 μm.
(H) Localization analysis for Edu, HP1γ and H3K9me3 along the indicated line scan (white arrow) in (G).
(I) Representative immunofluorescence images of HP1γ (green), PCNA (red), DAPI (blue) and their merge, and localization analysis for HP1γ puncta and PCNA along the indicated line scan (white arrow) in 4AKO SCC23 cells. Scale bars, 2 μm.
(J) Immunofluorescence staining of HP1γ (green), PCNA (red) and DAPI (blue), and localization analysis for HP1γ condensates and PCNA along the indicated line scan (white arrow) in primary SCCs from 4AKO mice. Enlarged images of single channels and merge were shown in inserts. Scale bars for main images, 5 μm. Scale bars for inserts, 2 μm.
