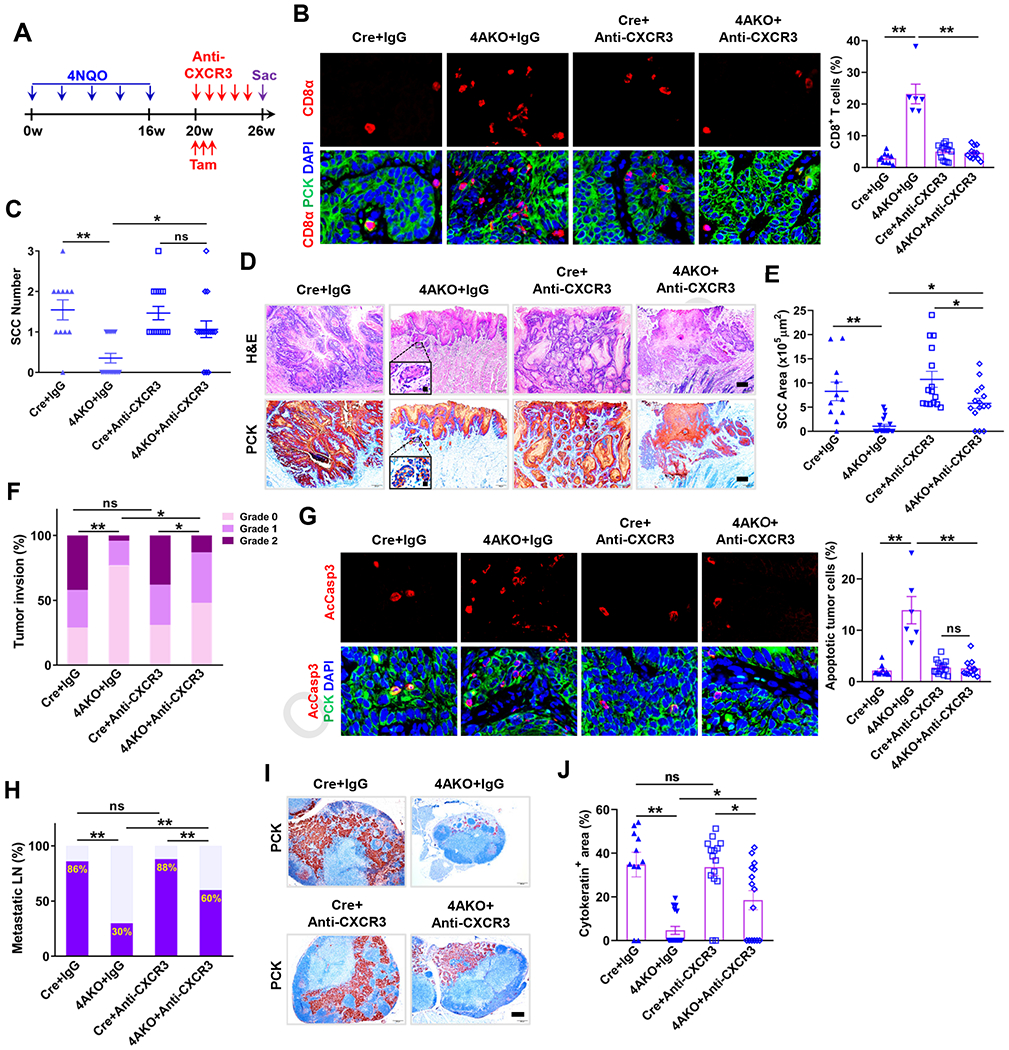
Figure 6. Th1-type Chemokines-induced CD8+ T Cell Infiltration Accounts for the Inhibitory Impacts of KDM4A Deletion on Primary Mouse SCC Growth and Lymphatic Metastasis.

(A) Schematic diagram for anti-CXCR3 treatment in Cre and 4AKO mice with 4-NQO-induced SCCs.
(B) Immunofluorescence staining and quantification of CD8+ T cell infiltration within primary mouse SCC in both Cre and 4AKO mice treated by IgG or anti-CXCR3. Scale bars, 10 μm. Values represent mean ± SEM from the pool of two independent experiments. n = 10:6:15:12. **p < 0.01 by two-way ANOVA.
(C) Quantification of primary mouse SCC number in both Cre and 4AKO mice treated by either IgG or anti-CXCR3. Values are mean ±SD from the pool of two-independent experiments. n = 11:17:15:15. ns, not significant, *p<0.05 and **p<0.01 by two-way ANOVA.
(D) Representative images showing H&E staining (upper) and PCK immunostaining (lower) of SCCs in both Cre and 4AKO mice treated by either IgG or anti-CXCR3. Scale bars, 200 μm. Inserts are enlarged images with 10 μm scale bars.
(E) Quantification of primary SCC areas. *p<0.05 and **p<0.01 by two-way ANOVA.
(F) Histogram analysis of tumor invasion degree. *p < 0.05, **p < 0.01 and ns, not significant by Cochran-Armitage test.
(G) Immunofluorescence staining and quantification of AcCasp3–positive tumor cells. Scale bars, 10μm. Values represent mean ± SEM from the pool of two independent experiments. n = 10:6:15:12. **p < 0.01 and ns, not significant by two-way ANOVA.
(H) Quantification of metastatic lymph nodes. ns, not significant and **p < 0.01 by Chisquare test.
(I) Immunostaining of PCK in lymph nodes. Scale bar, 200 μm.
(J) Quantification of metastatic areas in lymph nodes. Values represent mean ± SEM. n=11:17:15:15. ns, not significant, *p<0.05 and **p<0.01 by two-way ANOVA.
