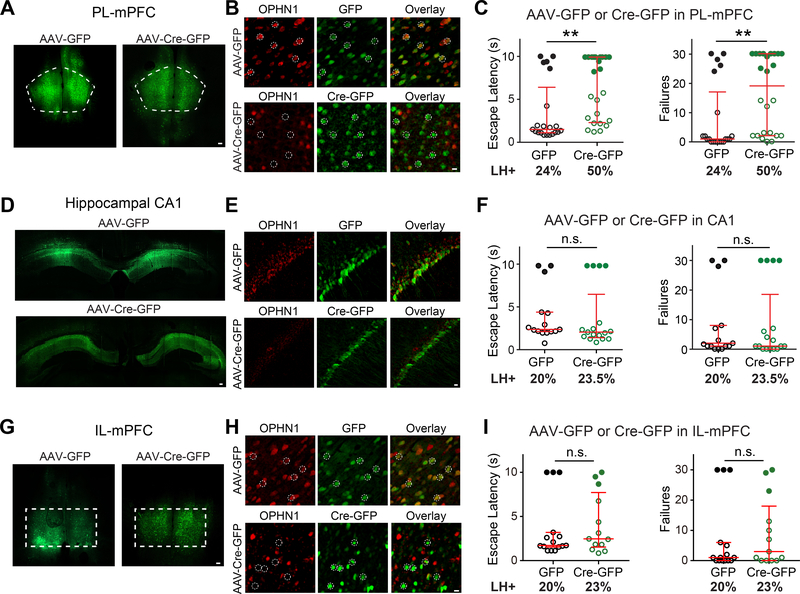
Figure 2. Ophn1 Deletion in PL-mPFC but not Hippocampal CA1 or IL-mPFC Promotes LH.
(A, D, G) Representative images showing expression of GFP or Cre-GFP in the prelimbic area of the medial prefrontal cortex (PL-mPFC) (A), hippocampal CA1 (D), and infralimbic area of the mPFC (IL-mPFC) (G) of Ophn1flox/Y mice injected with AAV-GFP and AAV-Cre-GFP, respectively. Scale bars, 100 μm.
(B, E, H) Representative images of neurons in the PL-mPFC (B), hippocampal CA1 (E), and IL-mPFC (H) of Ophn1flox/Y mice injected with AAV-GFP or AAV-Cre-GFP with immunostaining for OPHN1. Dashed-line circles depict randomly selected representative cells. Scale bars, 10 μm. (C, F, I) LH test of Ophn1flox//Y mice in which the PL-mPFC (C), hippocampal CA1 (F), or IL-mPFC (H) was injected with AAV-GFP or AAV-Cre-GFP. n = 13–24 mice per group; Mann-Whitney test. Data are presented with the median and interquartile ranges shown in red. Closed and open circles represent LH and resilient mice, respectively. Percentage of LH+ mice is indicated at the bottom of each group. n.s., p ≥ 0.05, **p < 0.01.
See also Figure S2.

