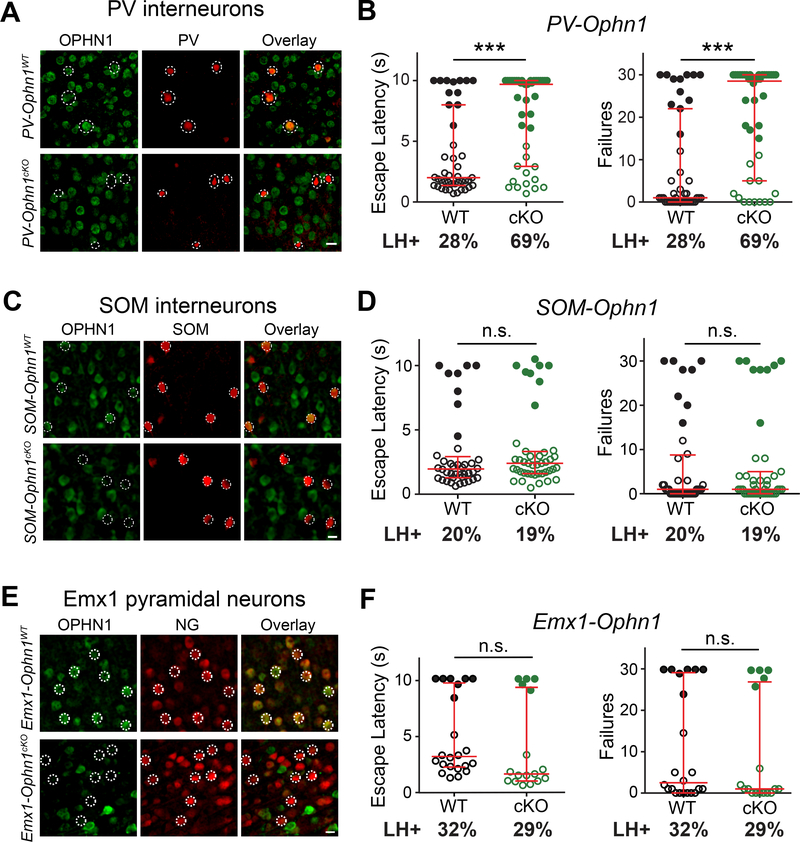
Figure 3. Ophn1 Deletion in PV INs, but not SOM INs or Emx1-expressing PyNs, Promotes LH.
(A, C, E) Representative images of neurons in the PL-mPFC of P50 PV-Ophn1WT and PV-Ophn1cKO (A), P50 SOM-Ophn1WT and SOM-Ophn1cKO (C), and P50 Emx1-Ophn1WT and Emx1-Ophn1cKO (E) mice with immunostaining for OPHN1 and parvalbumin (PV) (A), somatostatin (SOM) (C), or neurogranin (NG) (E). Scale bars, 10 μm.
(B, D, F) LH test of PV-Ophn1WT and PV-Ophn1cKO (B), SOM-Ophn1WT and SOM-Ophn1cKO (D), and Emx1-Ophn1WT and Emx1-Ophn1cKO (F) mice. n = 17–43 mice per group; Mann-Whitney test.
All data are presented with the median and interquartile ranges shown in red. Closed and open circles represent LH and resilient mice, respectively. Percentage of LH+ mice is indicated at the bottom of each genotype. n.s., p ≥ 0.05, ***p < 0.001.
See also Figure S3.

