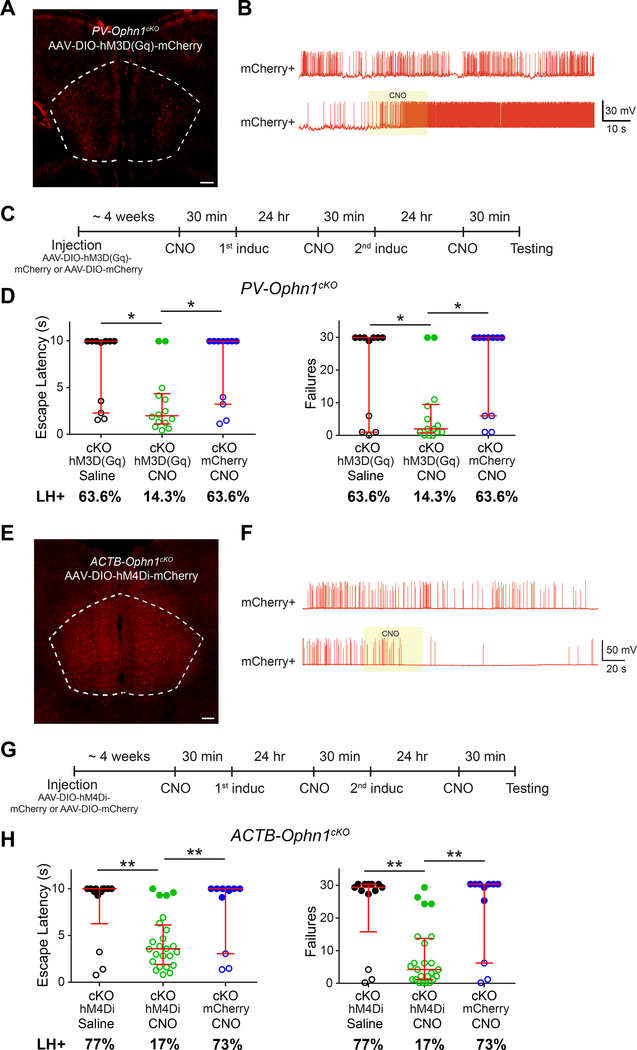
Figure 7. Normalizing PL-mPFC Neuronal Activity Alleviates Helpless Behavior in ACTB-Ophn1cKO mice.
(A) Representative image showing expression of hM3D(Gq)-mCherry in the PL-mPFC of PV-Ophn1cKO mice injected with Cre-dependent excitatory DREADD (AAV-DIO-hM3D(Gq)-mCherry). Scale bar, 200 μm.
(B) Representative traces of spontaneous spikes of hM3D(Gq)-mCherry-positive PV INs (mCherry+) without or with (yellow box) focal/puff application of CNO (20 μM).
(C) Schematic of experimental procedure for D.
(D) LH test of PV-Ophn1cKO (cKO) mice in which the PL-mPFC was injected with AAV-DIO-hM3D(Gq)-mCherry or AAV-DIO-mCherry and subsequently treated with saline or CNO. n = 11–14 mice per group; Kruskal-Wallis with Dunn’s post-hoc test.
(E) Representative image showing expression of hM4Di-mCherry in the PL-mPFC of ACTB-Ophn1cKO mice injected with Cre-dependent inhibitory DREADD (AAV-DIO-hM4Di-mCherry).
Scale bar, 200 μm.
(F) Representative traces of spontaneous spikes of hM4Di-mCherry-positive neurons (mCherry+) without or with (yellow box) focal/puff application of CNO (20 μM).
(G) Schematic of experimental procedure for H.
(H) LH test of ACTB-Ophn1cKO (cKO) mice in which the PL-mPFC was injected with AAV-DIO-hM4Di-mCherry or AAV-DIO-mCherry and subsequently treated with saline or CNO. n = 11–24 mice per group; Kruskal-Wallis with Dunn’s post-hoc test.
For D, H, data are presented with the median and interquartile ranges shown in red. Closed and open circles represent LH and resilient mice, respectively. Percentage of LH+ mice is indicated at the bottom of each group. *p < 0.05, **p < 0.01.
See also Figure S7.

