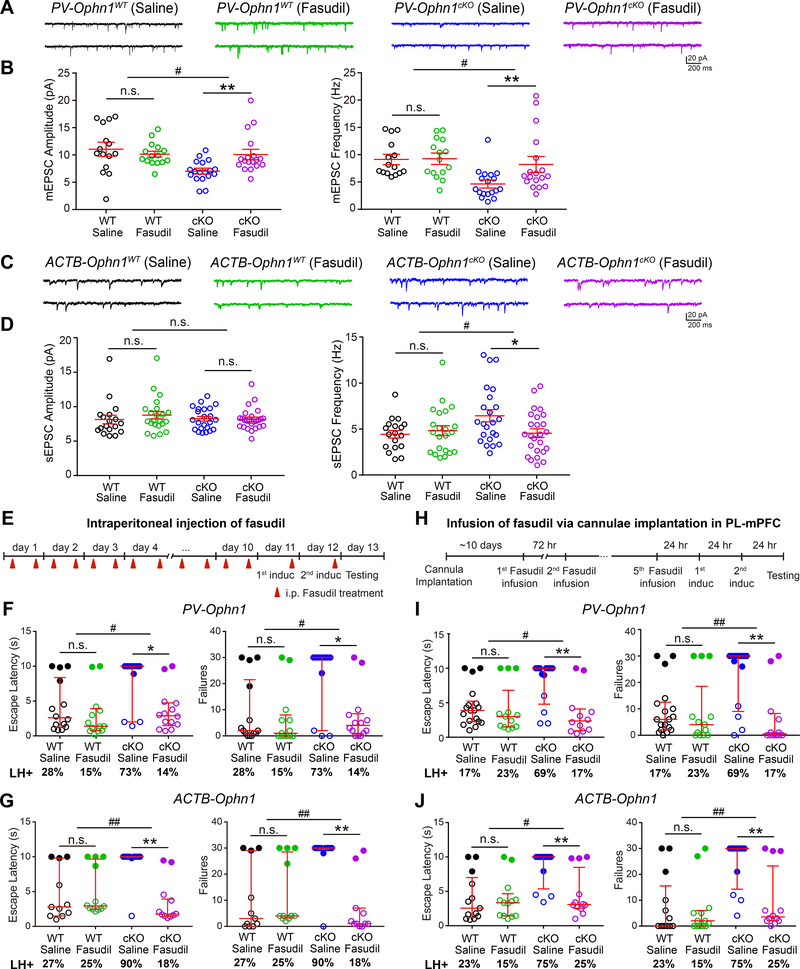
Figure 8. Suppressing RhoA/Rho-Kinase Pathway Normalizes PL-mPFC Neuronal Hyperactivity and Attenuates Helpless Behavior in Ophn1-Deficient Mice.
(A) Representative traces of mEPSCs recorded from LII/III PV INs in the PL-mPFC of PV-Ophn1WT (left) and PV-Ophn1cKO (right) mice treated with saline or fasudil.
(B) Quantification of mEPSC amplitude and frequency. n = 15–18 cells from 3 mice for each genotype/condition; Two-way ANOVA (Amplitude: genotype x treatment interaction F(1, 62) = 6.539, p = 0.013; Frequency: genotype x treatment interaction F(1, 62) = 4.069, p = 0.048) with Bonferroni post-hoc test.
(C) Representative traces of sEPSCs recorded from LII/III PyNs in the PL-mPFC of ACTB-Ophn1WT (left) and ACTB-Ophn1cKO (right) mice treated with saline or fasudil.
(D) Quantification of sEPSC amplitude and frequency. n = 18–25 cells from 3–4 mice for each genotype/condition; Two-way ANOVA (Amplitude: genotype x treatment interaction F(1, 84) = 1.507, p = 0.223; Frequency: genotype x treatment interaction F(1, 84) = 4.394, p = 0.04) with Bonferroni post-hoc test.
(E) Schematic of experimental procedure for F and G.
(F) LH test of PV-Ophn1WT (WT) and PV-Ophn1cKO (cKO) mice treated with saline or fasudil. n = 11–14 mice per group; Aligned-Rank Transform ANOVA (Escape latencies: genotype x treatment interaction F(1, 48) = 4.097, p = 0.048; Failures: genotype x treatment interaction F(1, 48) = 5.314, p = 0.025) followed by multiple comparisons using Mann-Whitney test with Bonferroni correction.
(G) LH test of ACTB-Ophn1WT (WT) and ACTB-Ophn1cKO (cKO) mice treated with saline or fasudil. n = 10–12 mice per group; Aligned-Rank Transform ANOVA (Escape latencies: genotype x treatment interaction F(1, 40) = 9.092, p = 0.0044; Failures: genotype x treatment interaction F(1, 40) = 11.98, p = 0.0013) followed by multiple comparisons using Mann-Whitney test with Bonferroni correction.
(H) Schematic of experimental procedure for I and J.
(I) LH test of PV-Ophn1WT (WT) and PV-Ophn1cKO (cKO) mice with guide cannulae in the PL-mPFC infused with saline or fasudil. n = 12–18 mice per group; Aligned-Rank Transform ANOVA (Escape latencies: genotype x treatment interaction F(1, 52) = 6.37, p = 0.015; Failures: genotype x treatment interaction F(1, 52) = 7.662, p = 0.0078) followed by multiple comparisons using Mann-Whitney test with Bonferroni correction.
(J) LH test of ACTB-Ophn1WT (WT) and ACTB-Ophn1cKO (cKO) mice with guide cannulae in the PL-mPFC infused with saline or fasudil. n = 12–13 mice per group; Aligned-Rank Transform ANOVA (Escape latencies: genotype x treatment interaction F(1, 46) = 4.689, p = 0.035; Failures: genotype x treatment interaction F(1, 46) = 7.528, p = 0.0086) followed by multiple comparisons using Mann-Whitney test with Bonferroni correction.
For B and D, data are mean ± SEM. For F, G, I, J, data are presented with the median and interquartile ranges shown in red. Closed and open circles represent LH and resilient mice, respectively. Percentage of LH+ mice is indicated at the bottom of each group. n.s., p ≥ 0.05, *p < 0.05, **p < 0.01, #p < 0.05, ##p < 0.01.
See also Figures S8 and S9.

