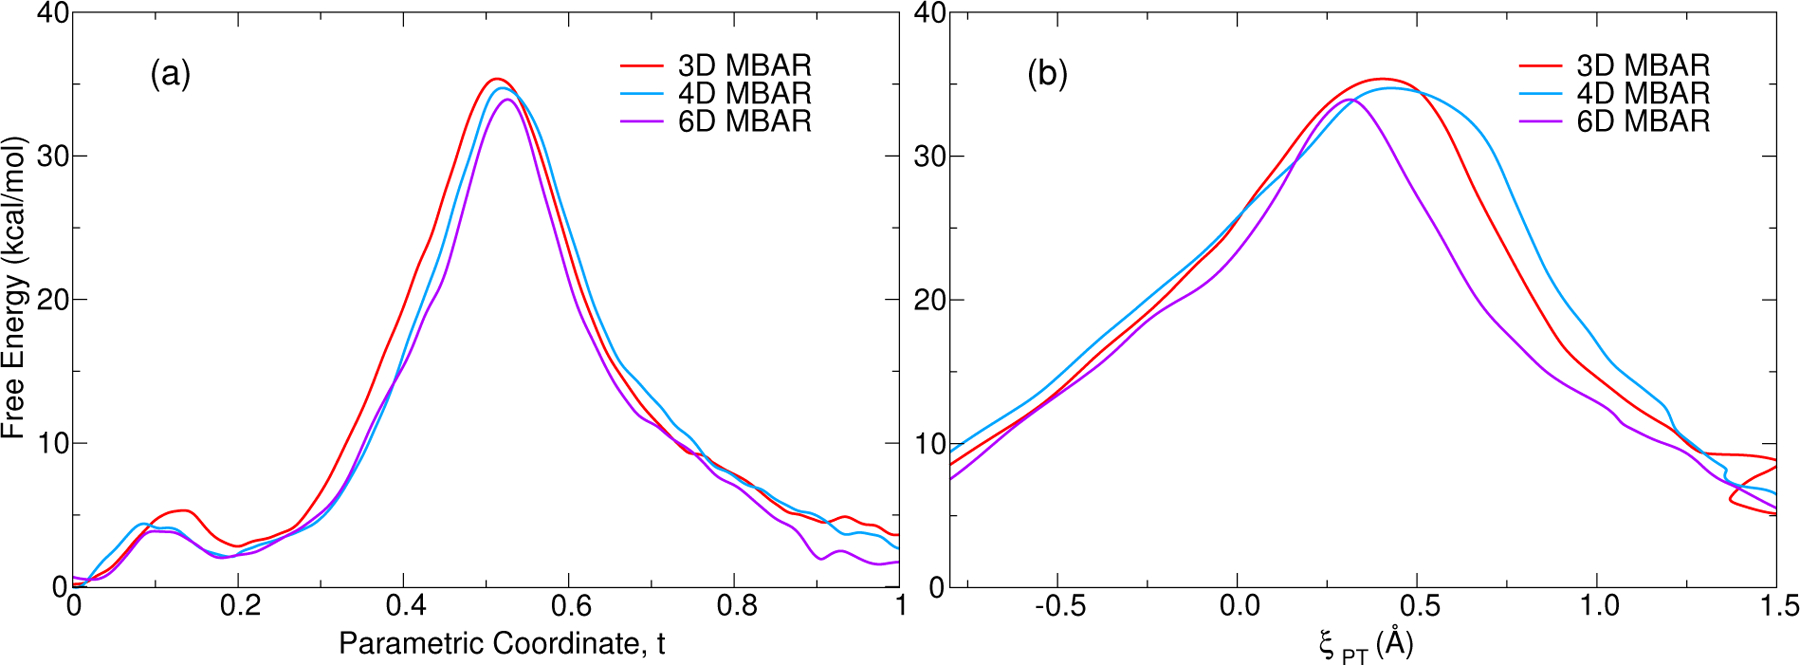
Figure 11:

Comparison of minimum free energy paths from 3D, 4D and 6D representations of the associative transphosphoylation reaction catalyzed by the HHr. Left panel shows the RBF MBAR free energy with respect to progress along the path. Right panel shows the MBAR results with respect to the phosphoryl transfer coordinate ξPT.
