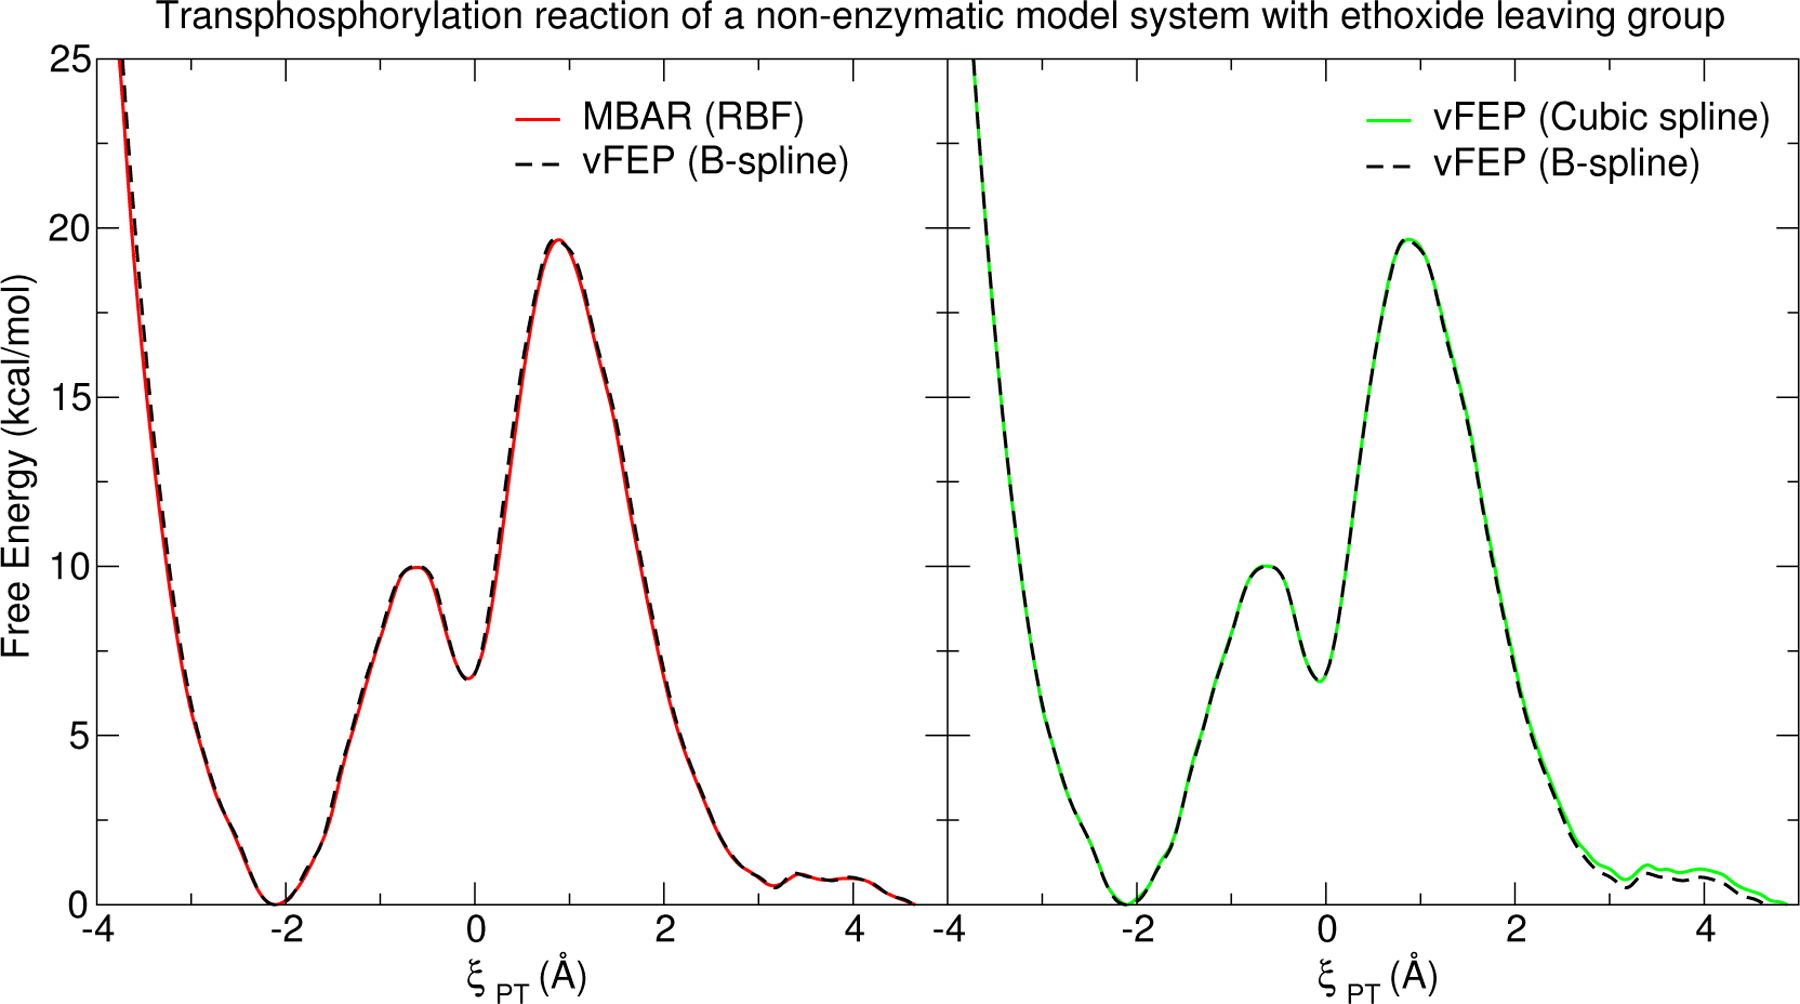
Figure 3:

Free energy curve (1D) for the associative transphosphorylation reaction of a non-enzymatic model system with an ethoxide leaving group (illustrated in Fig. 1) simulated with PBE0/6–31G* QM/MM in explicit TIP4P/Ew water. Analysis with vFEP (B-spline) was performed using B-spline order 5 and 0.15 Å node spacing.
