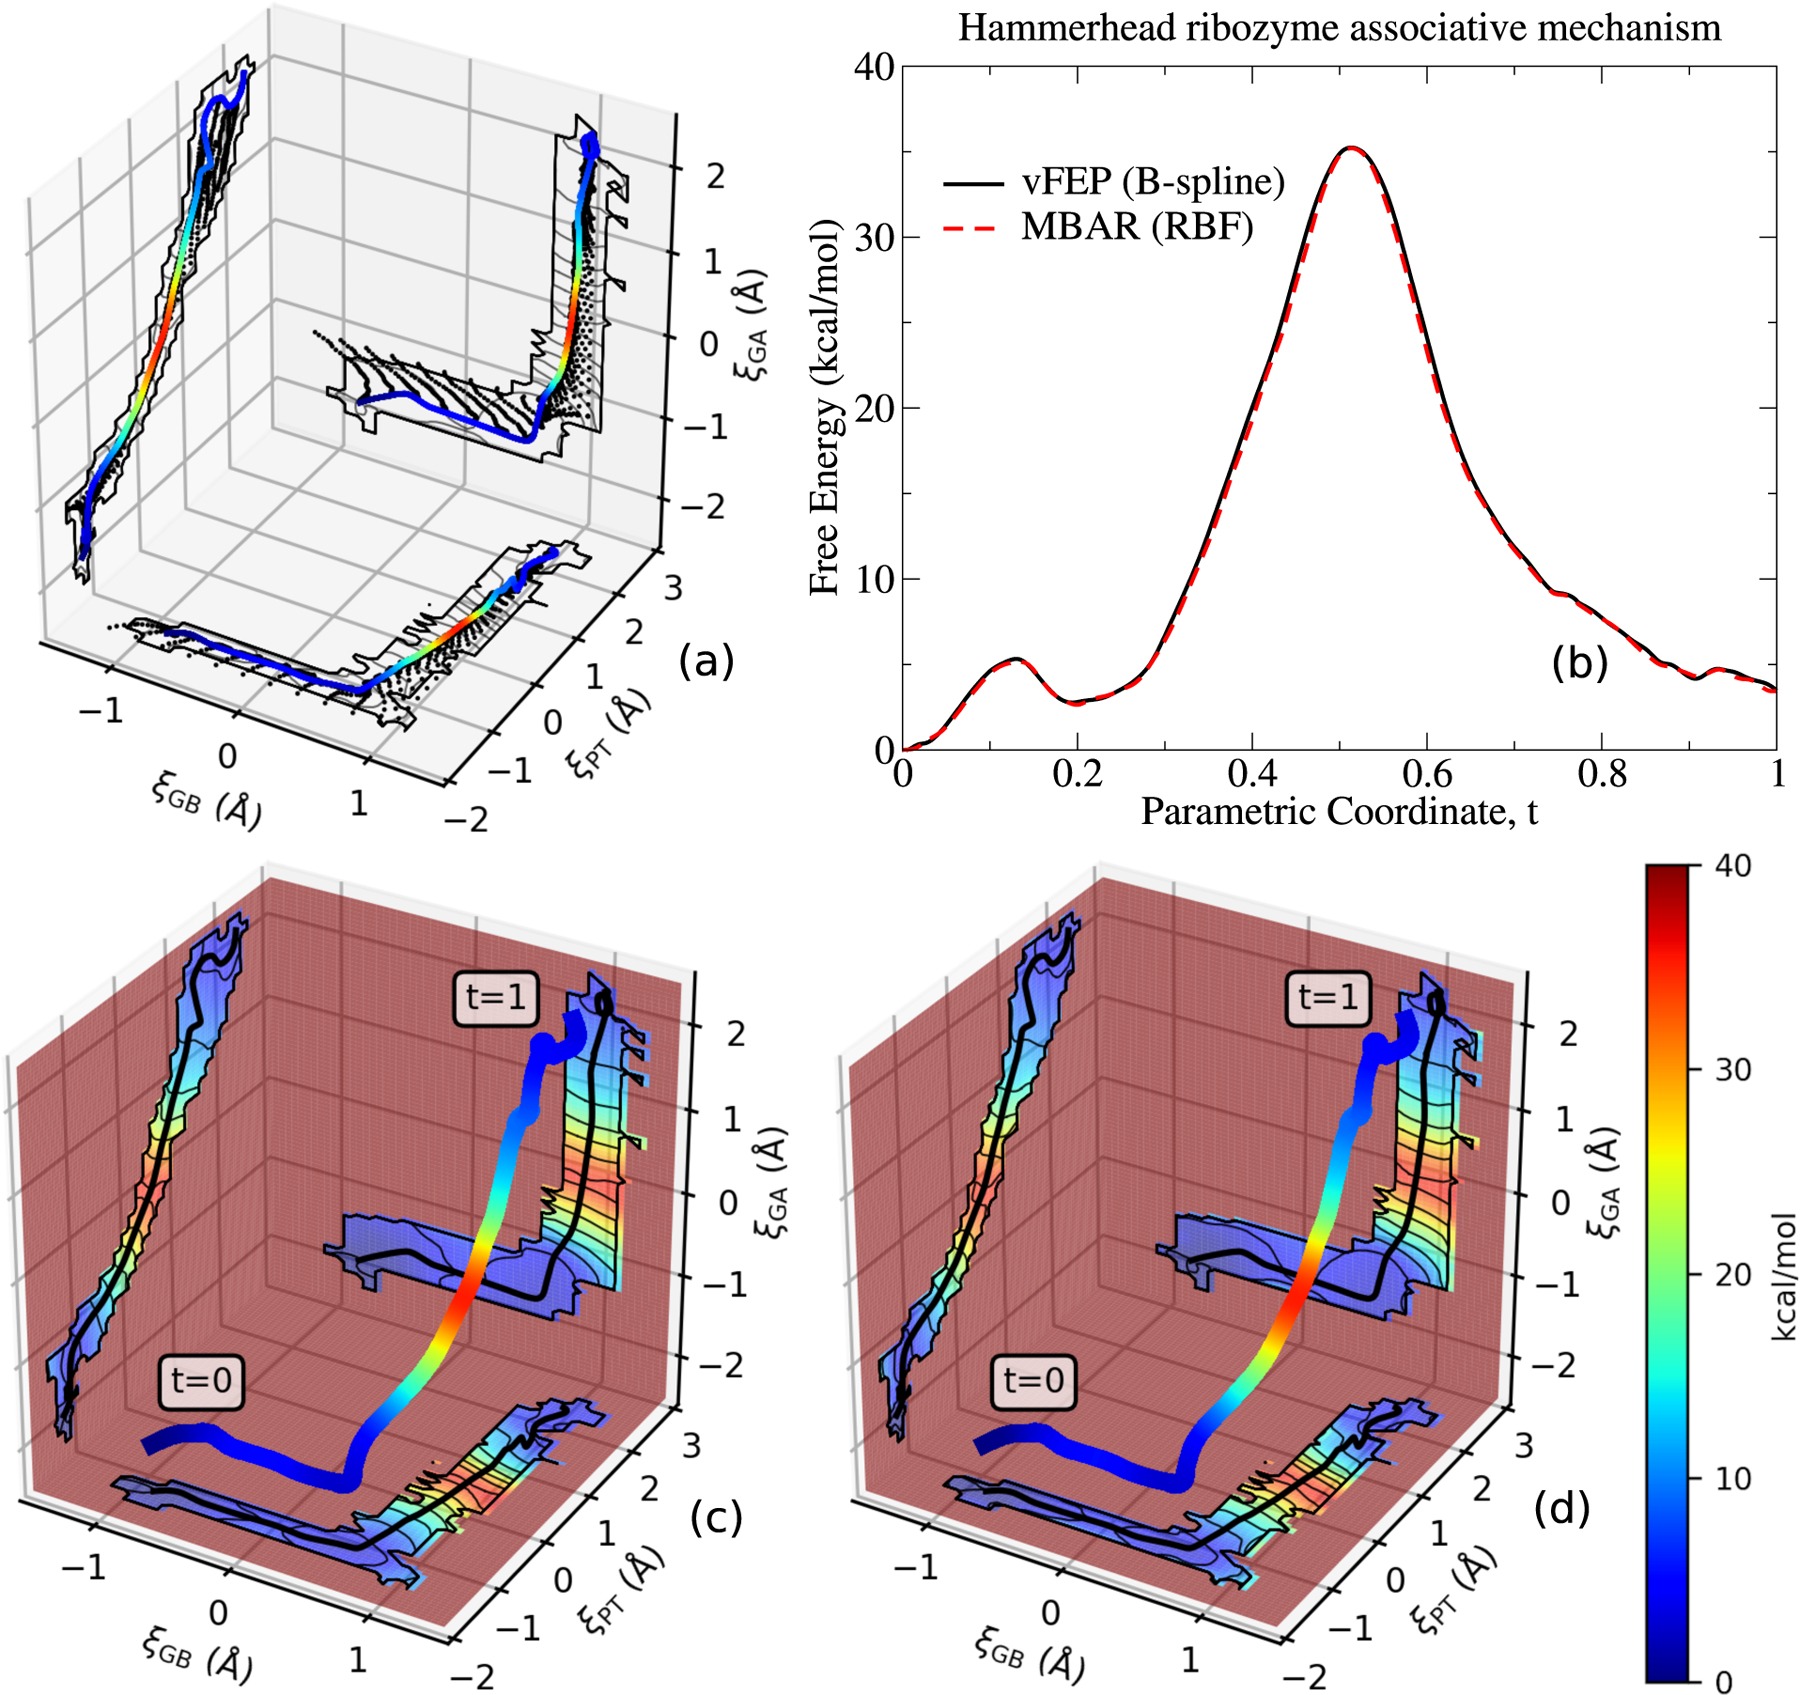
Figure 9:

Free energy surface (3D) for the associative transphosphoylation reaction catalyzed by the HHr (illustrated in Fig. 2) computed from AM1/d-PhoT QM/MM. Subplot (a) shows the umbrella window locations encountered by the finite temperature string umbrella sampling method. The umbrella window locations are projected onto planes intersecting the final path, which is shown as the colored line. The RBF MBAR and B-spline vFEP free energy profile of the final path is shown in figure (b). Figures (c) and (d) display the RBF MBAR and B-spline vFEP free energy surfaces projected onto planes that intersect the final path.
