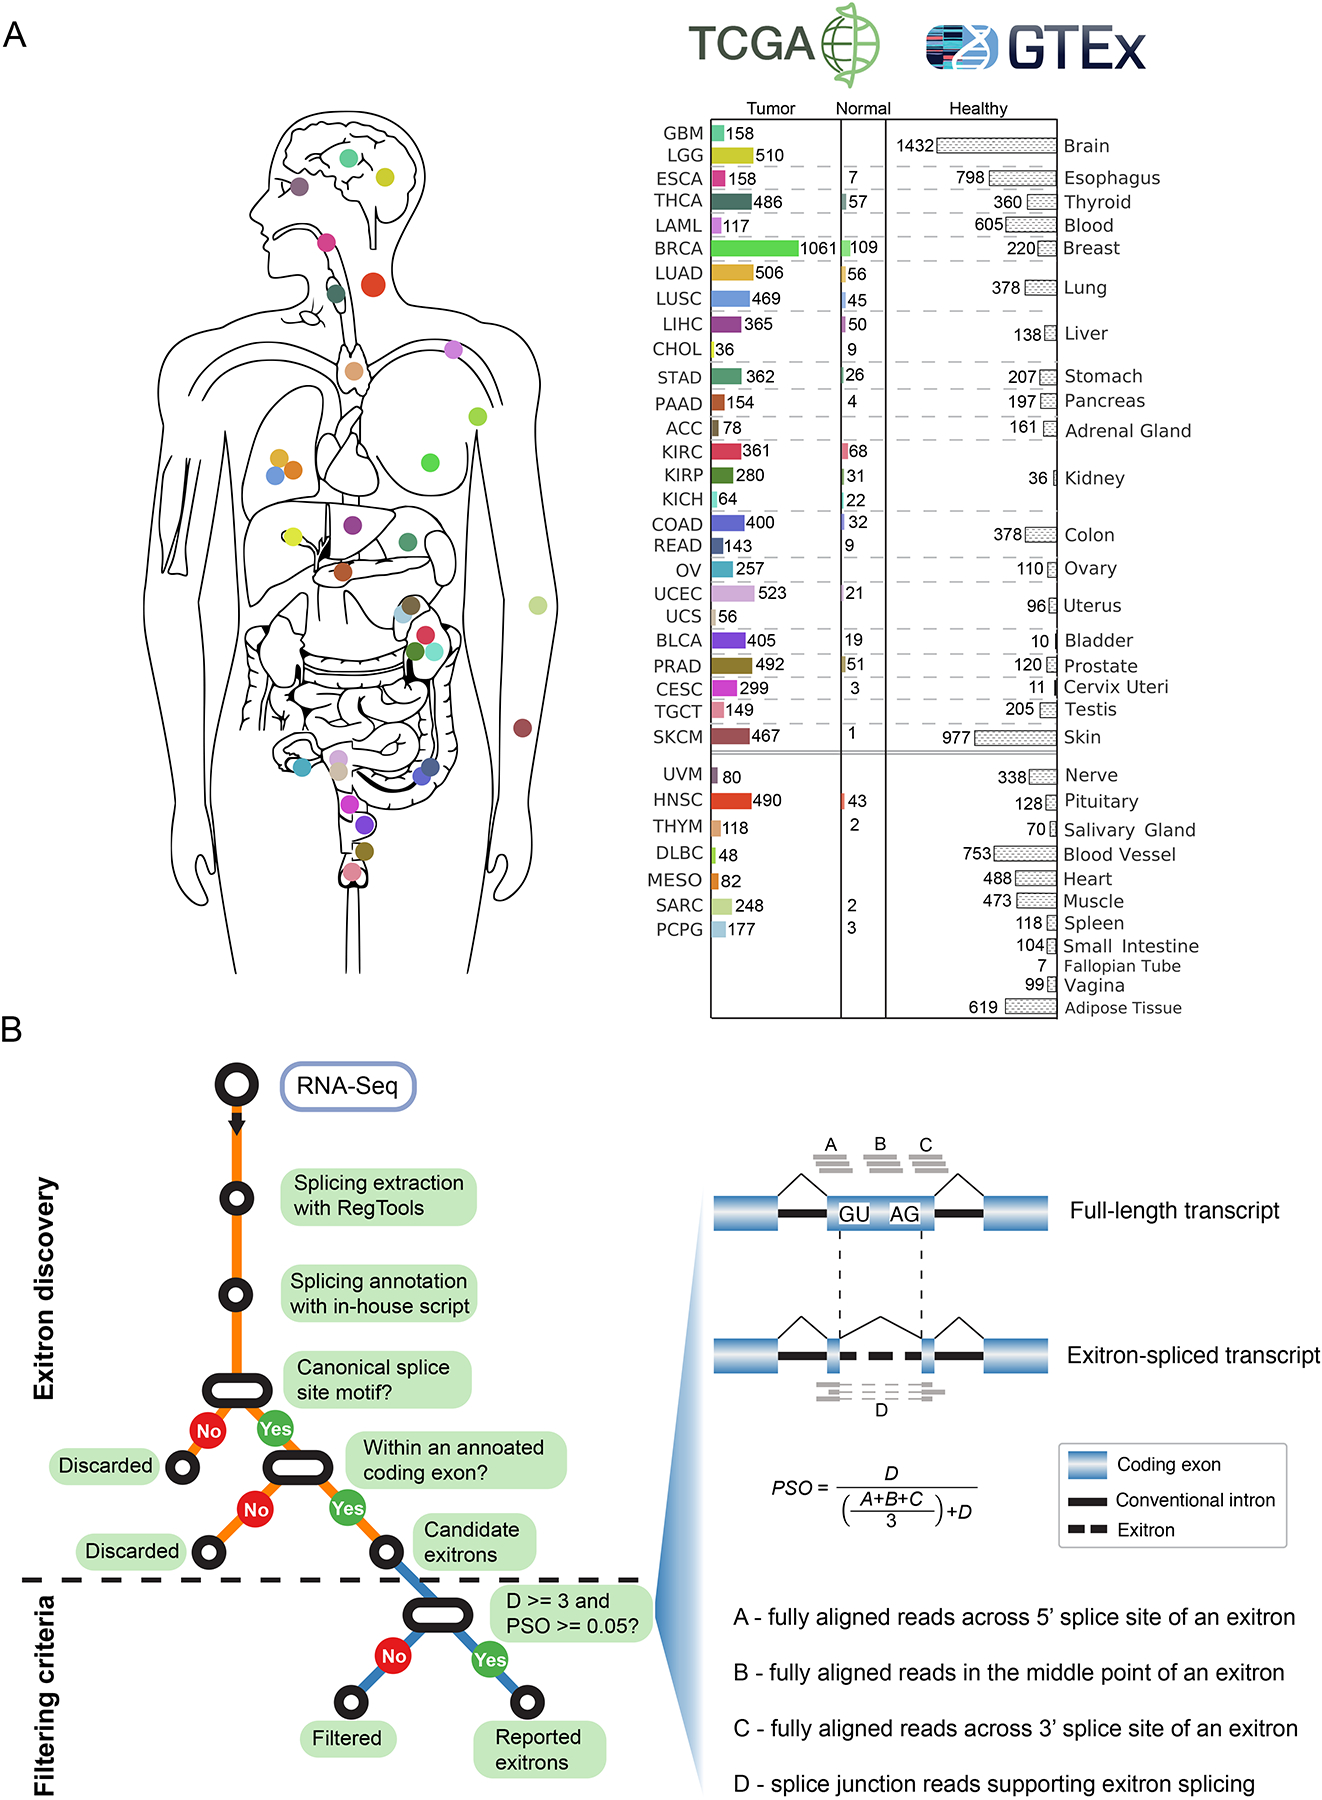
Figure 1. Samples and workflow for exitron splicing discovery.

(A) Data source for the 33 cancer types in this study. Bar charts describe numbers of tumor and matched normal samples for each cancer type from TCGA (with color) and healthy samples from GTEx (without color). The number of samples with available RNA-Seq data is indicated. (B) Workflow and criteria of exitron detection in TCGA data. Left, the computational pipeline to detect exitron splicing events within annotated protein-coding exons from TCGA RNA-Seq data. Right, the criteria to report an exitron splicing event including the number of supporting reads (indicated by D) and a percent spliced out (PSO) metric.
