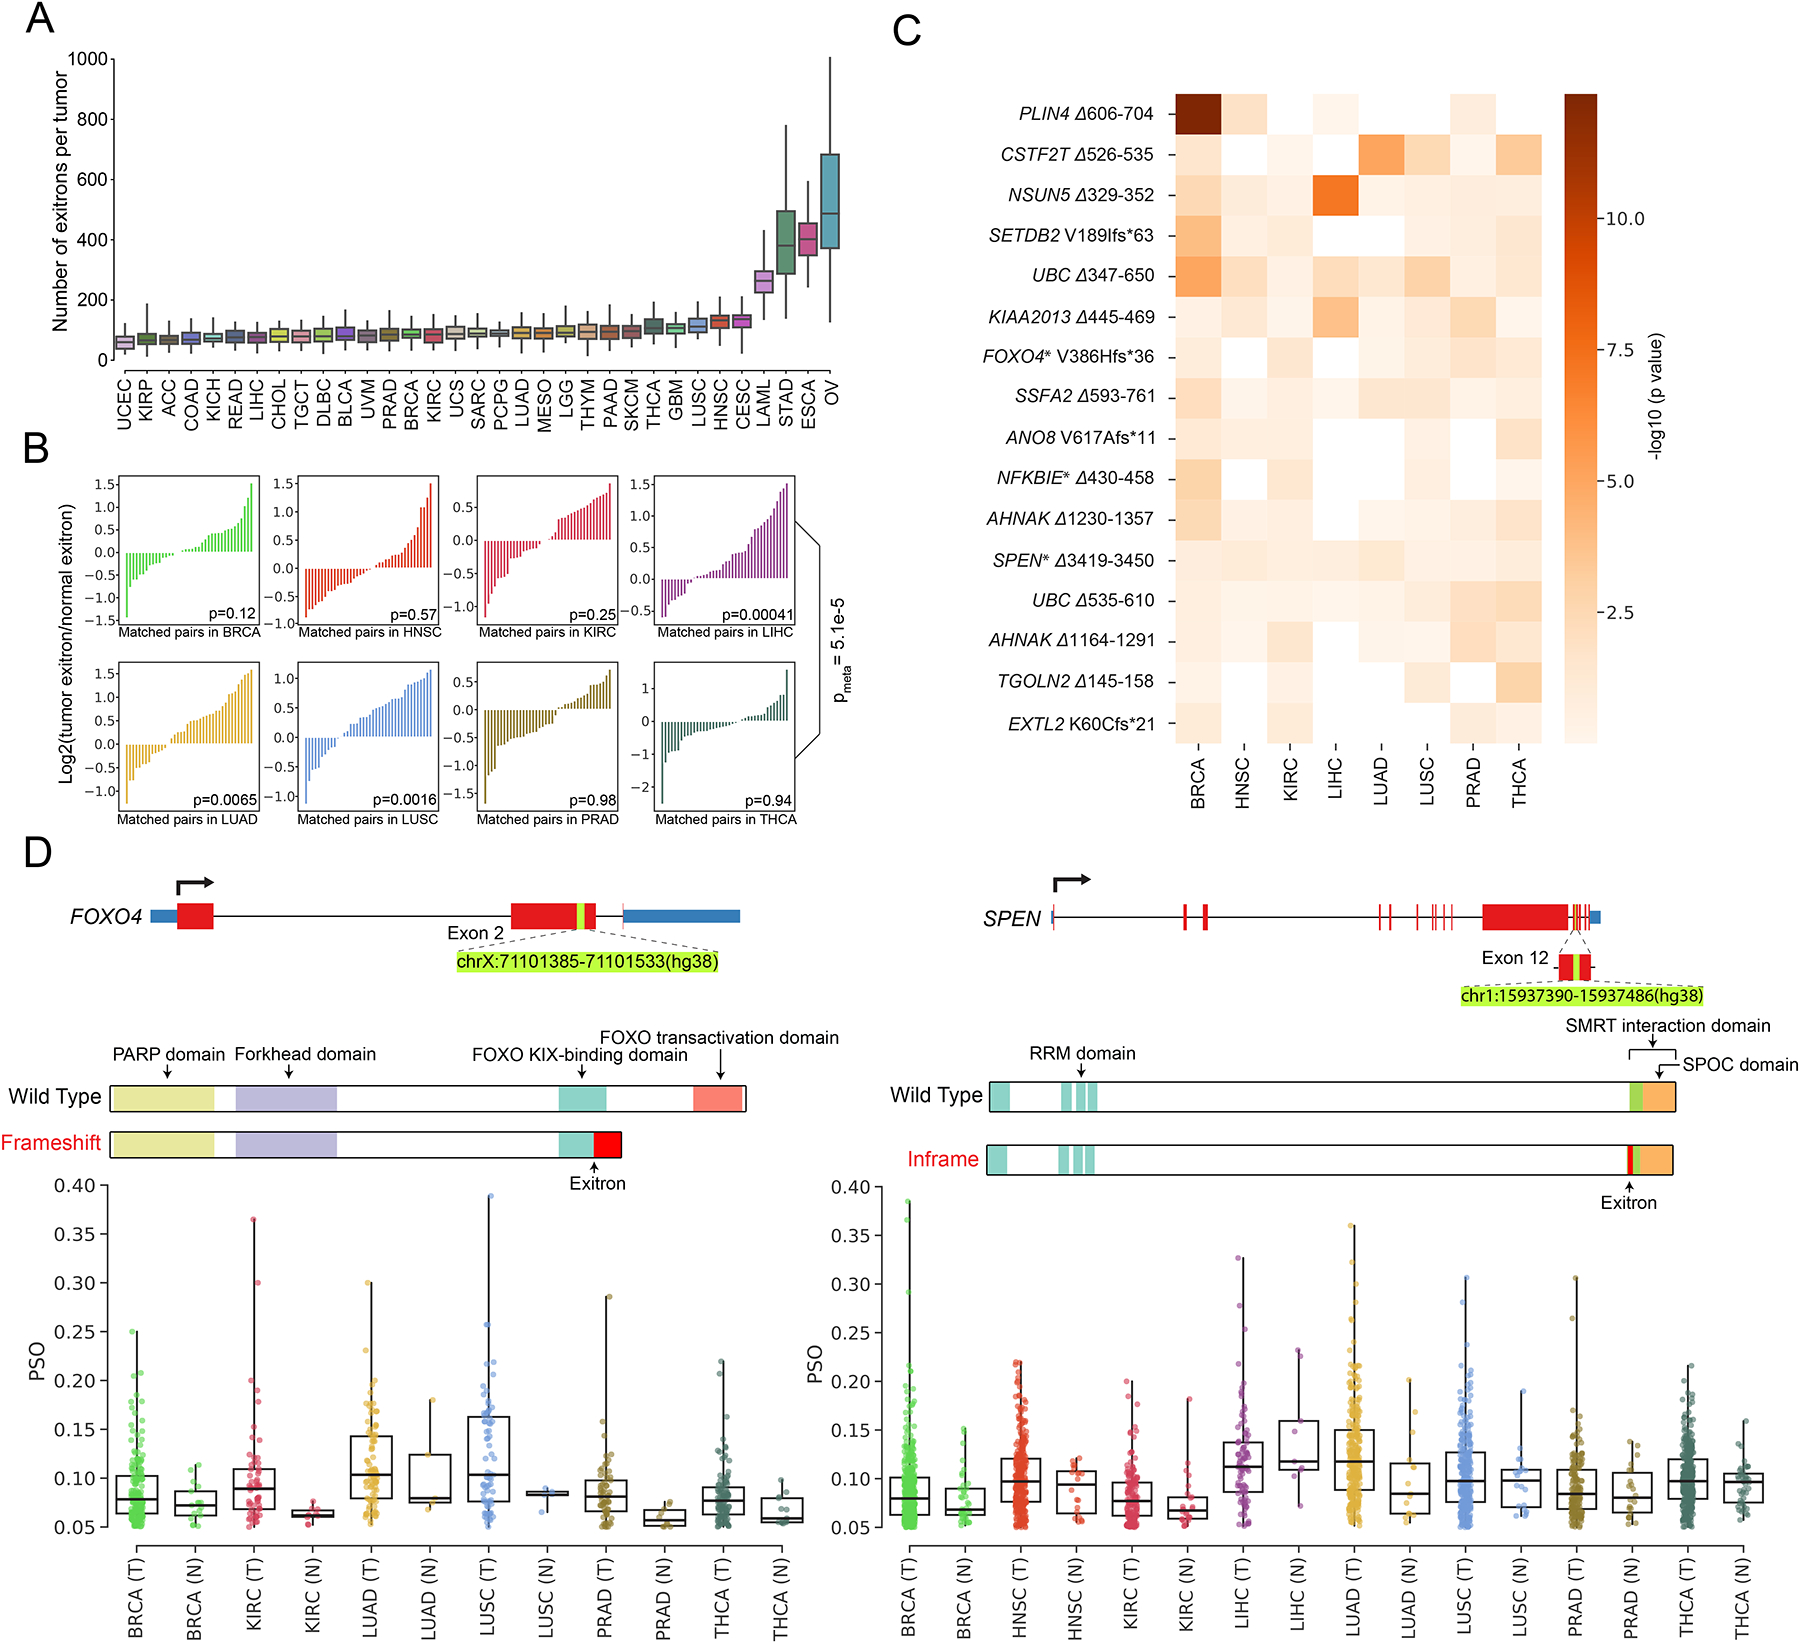
Figure 2. Detection of dysregulated exitron splicing (EIS) events in cancer.

(A) Count of EIS events across 33 cancer types. For each cancer type, we randomly choose 36 samples for EIS burden evaluation to account for cohort size variations. (B) Pairwise comparison of EIS load in 40 randomly selected pairs of tumor specimens (T) and matched adjacent histologically normal tissues (N) for TCGA cancer types with at least 40 T/N matched samples. The p value is calculated using the Wilcoxon signed-ranks test. (C) Results of differential splicing analysis of exitrons between tumor and normal tissues for 8 cancer types. Rows represent 16 dysregulated exitrons that were found to be differentially spliced after FDR correction. Shading corresponds to −log10(p value). Columns represent cancer types. Genes marked with an asterisk are annotated in the COSMIC cancer gene census. (D) Illustration of the dysregulated EIS events identified in FOXO4 (left) and SPEN (right) and comparison of their splicing between tumor and normal samples for the eight TCGA cancer types. Each dot corresponds to the percent spliced out (PSO) value of the selected EIS in one sample.
