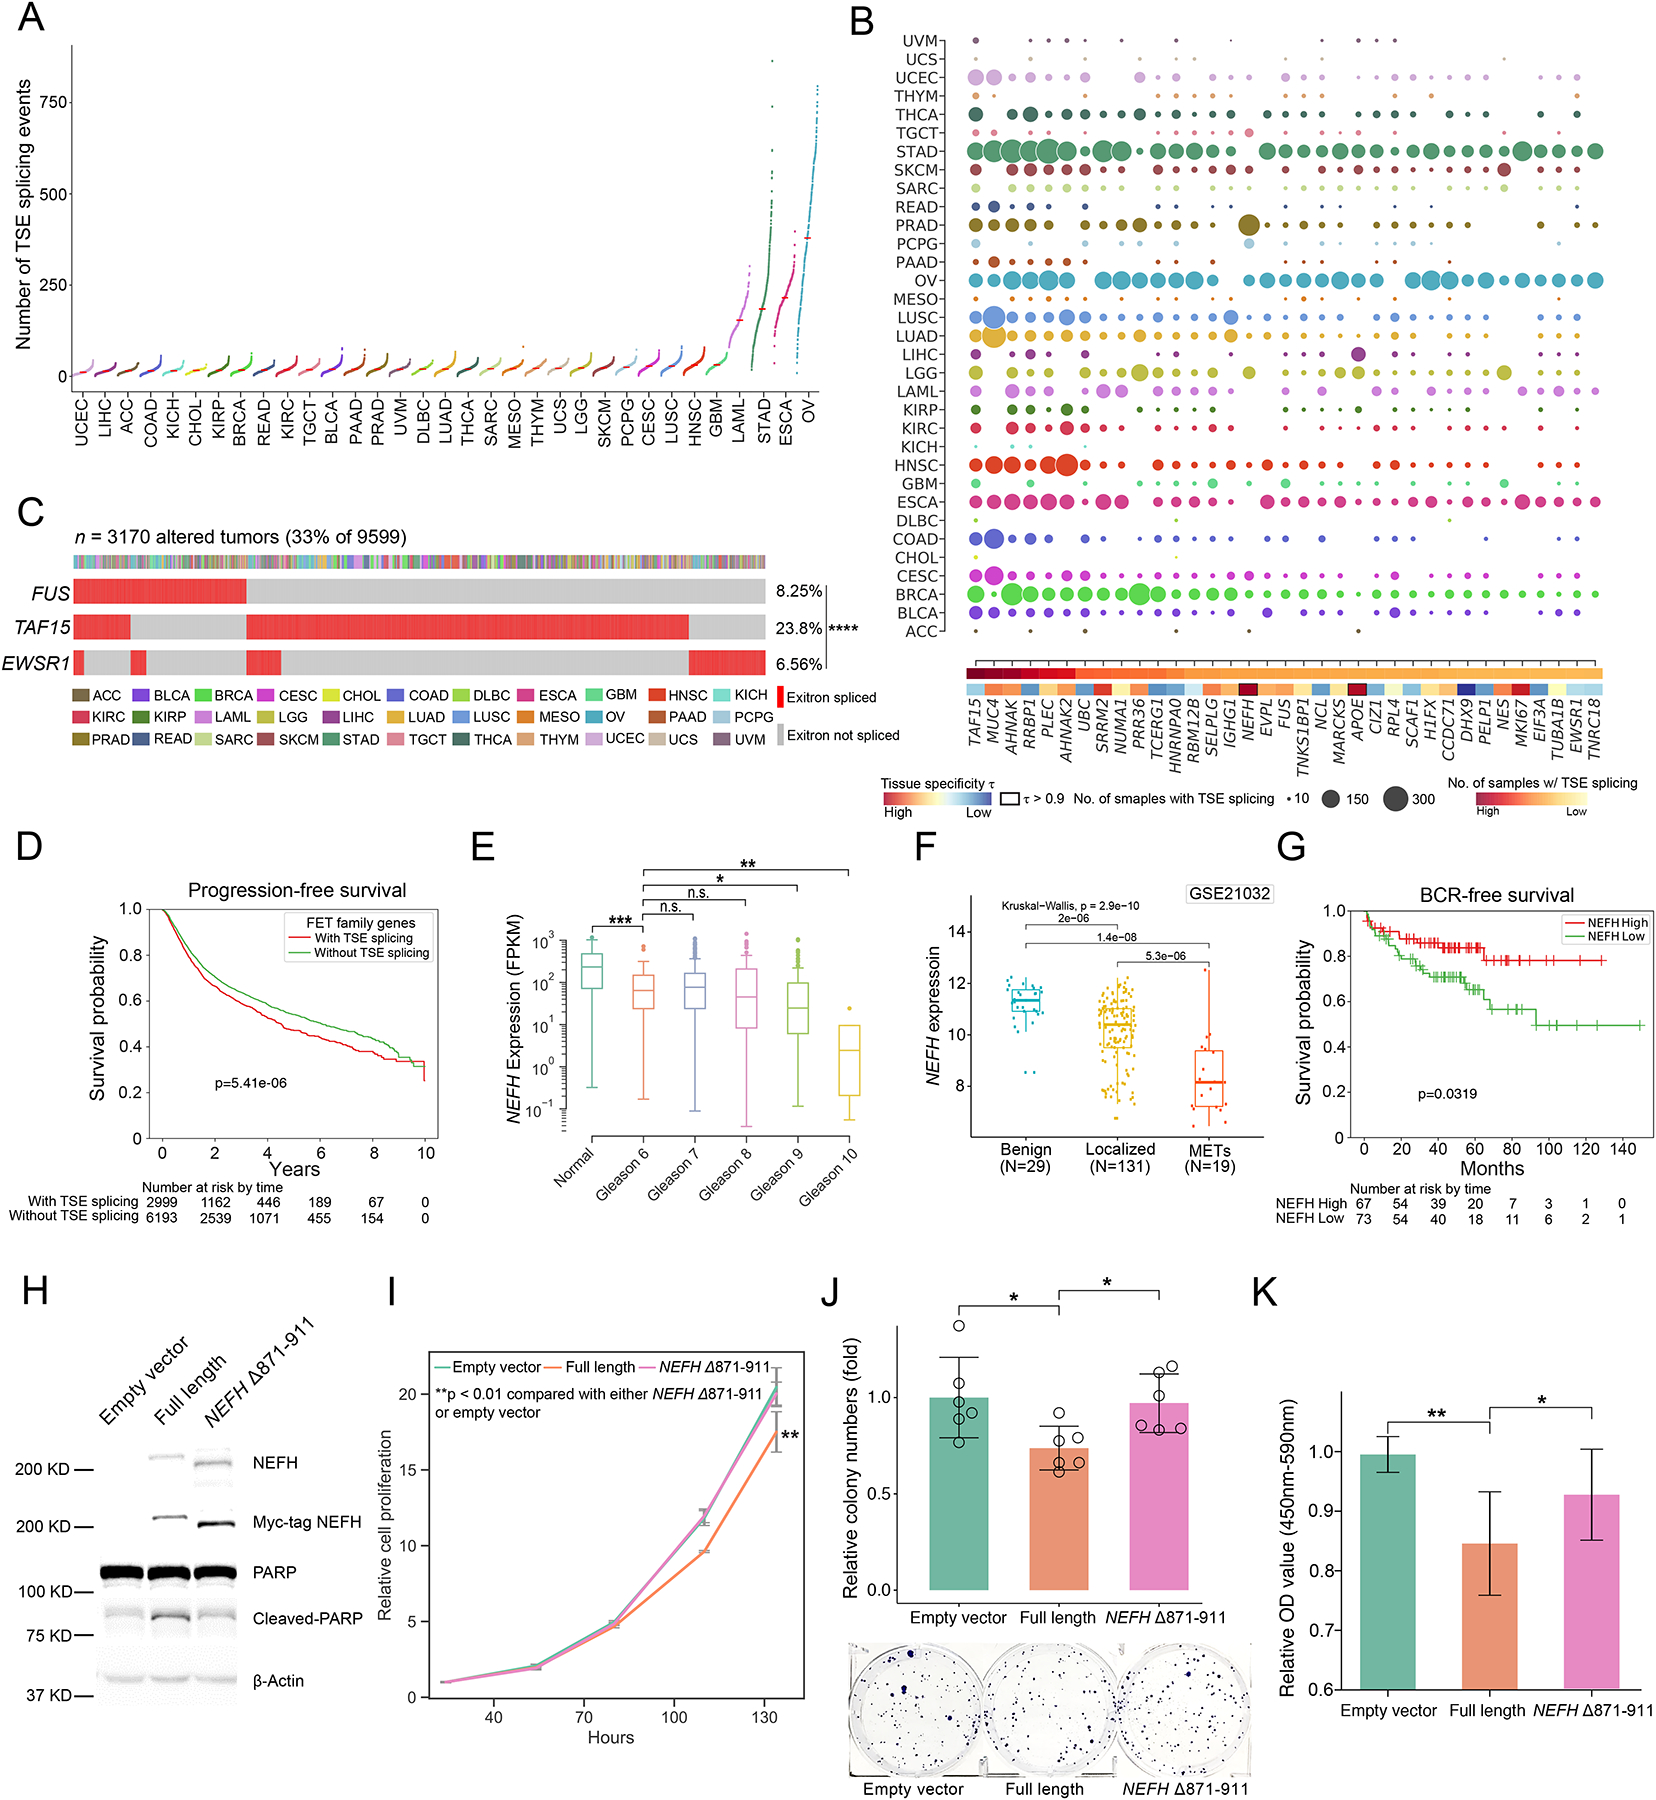
Figure 3. Detection of genes enriched with tumor-specific exitrons (TSEs).

(A) Number of TSE splicing events for TCGA cohorts. Each dot represents the number of TSE splicing events in a TCGA tumor sample. (B) Top 35 significantly exitron-spliced genes (SEGs). Circle size correlates with the number of samples with spliced TSEs and colored by cancer type. Highly tissue specific SEGs (τ > 0.9) are highlighted. (C) Mutual exclusivity of exitron splicing events in FET genes including EWSR1, FUS and TAF15 in TCGA pan-cancer cohort (****p < 0.0001, Fisher’s exact test). (D) Exitron splicing of FET family genes predicts progression-free survival in TCGA pan-cancer cohort. (E) The expression of the SEG gene NEFH is correlated with Gleason grade in PRAD cohort (n.s., not significant (p > 0.05), *p < 0.05, **p < 0.01, ***p < 0.001, Mann-Whitney rank test). (F) NEFH is downregulated in prostate tumors. NEFH mRNA expression from microarray data set (GSE21032) is compared in benign, localized, and metastatic prostate cancer. The p value is calculated by Kruskal-Wallis test. (G) Low NEFH mRNA expression is associated with poor clinical outcome. Kaplan-Meier analysis of prostate cancer outcome using GSE21032 dataset is shown. Prostate cancer cases are stratified based on their NEFH mRNA expression level and analyzed for biochemical recurrence. The p value is calculated by a log-rank test. (H) Representative western blot against C4-2 stable cell lines expressing Myc-tagged wild-type NEFH and exitron-spliced NEFH. Apoptosis was evaluated by western blot analysis for poly (ADP-ribose) polymerase (PARP) cleavage. (I) CellTiter-Glo growth assays indicate that overexpression of wild-type NEFH, but not exitron-spliced NEFH, significantly inhibited cell growth in C4-2 cells. (J) Overexpressing wild-type NEFH significantly decreased colony-formation ability of C4-2 cells. Cells were fixed and stained with crystal violet. n = 6. The figure is a representative of three experiments with similar results. Quantification was performed by manual counting. (K) BrdU ELISA assay of C4-2 cells overexpressing wild-type NEFH and or exitron-spliced NEFH with 24hrs of BrdU label (n=9). Y axis, absorbance of 450–590 nm relative to empty vector. There was less incorporation of BrdU in cells expressing wild-type NEFH. All p values are calculated using unpaired, two-tailed Student’s t-test. Error bars indicate ± s.d. (*p < 0.05, **p < 0.01, ***p < 0.001).
