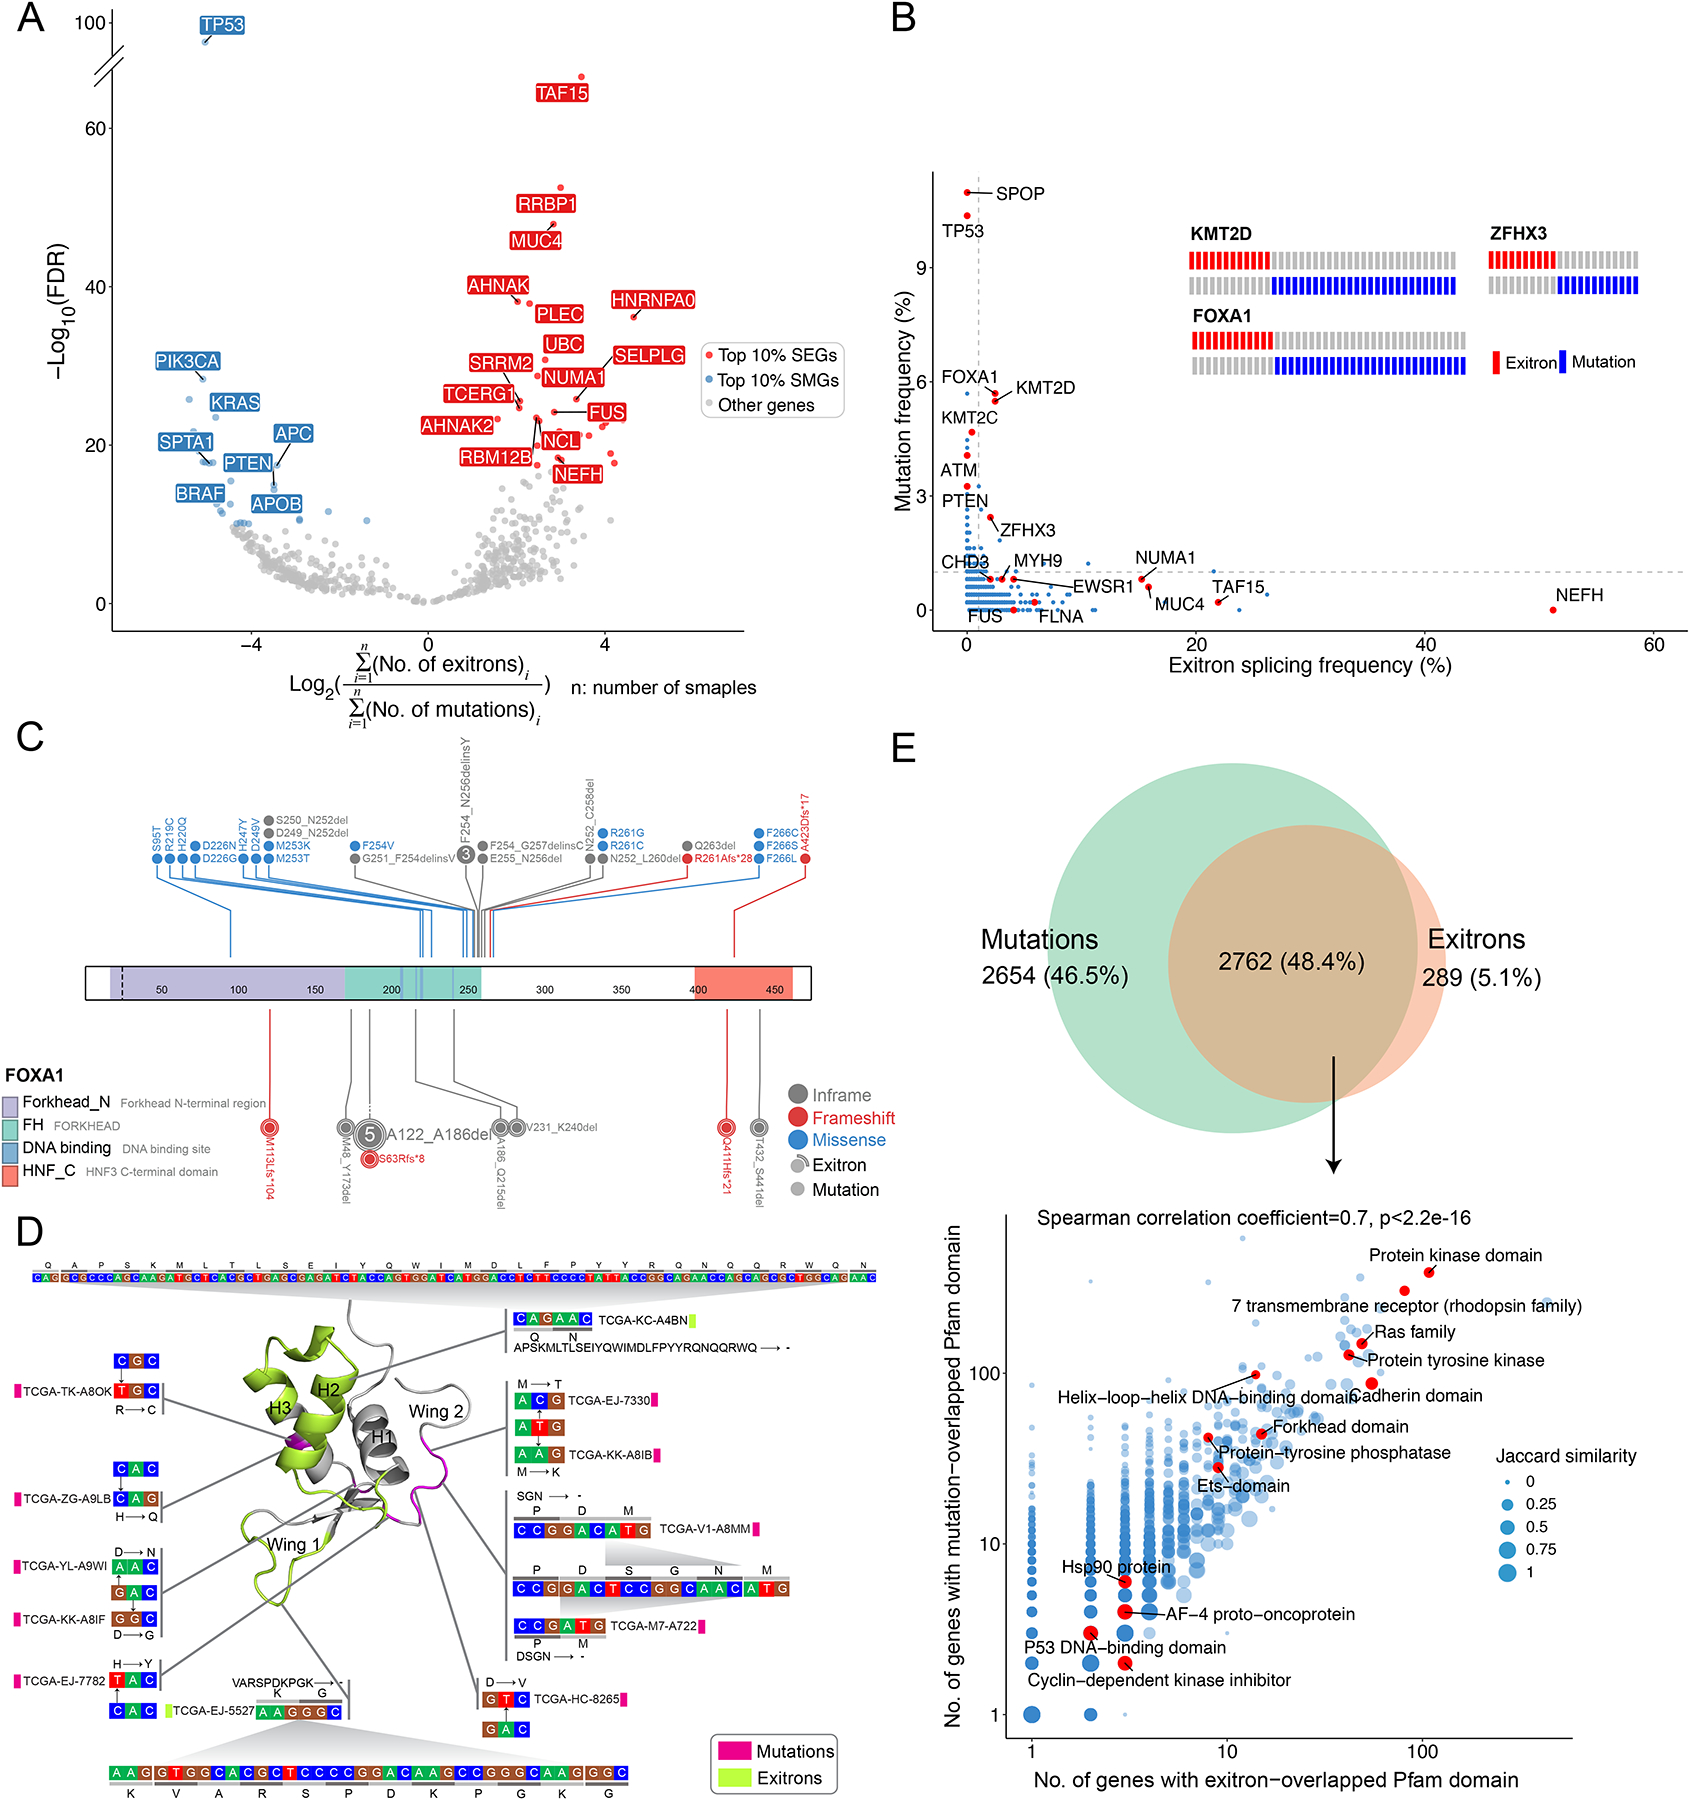
Figure 4. Comparison of TSE splicing and somatic mutations.

(A) Volcano plot shows mutation and TSE splicing frequency difference separating genes as SMGs and SEGs. (B) The frequencies of mutation and exitron splicing events in genes are inversely correlated in the PRAD cohort. DNA mutations and exitron splicing are mutually exclusive in FOXA1, KMT2D, and ZFHX3. Genes of interest are highlighted. (C) DNA mutations and exitron splicing are clustered in the forkhead DNA binding domain of the FOXA1 gene in PRAD. (D) The nucleotide and amino acid changes caused by exitron splicing and somatic mutations are shown against the 3D structure of the FOXA1 forkhead domain. The α-helix and wing regions are highlighted. (E) Comparison on Pfam protein domains affected by somatic mutations versus exitron splicing events. Venn diagram (top panel) shows that Pfam domains affected by somatic mutations or exitron splicing events share extensive overlap. The scatterplot (bottom panel) shows high correlation (Spearman correlation coefficient = 0.7) in the Pfam domains affected by exitron splicing events and somatic mutations. Pfam domains of interest are highlighted. Jaccard similarity is used to measure the similarity between exitron splicing- and mutation-altered gene sets.
