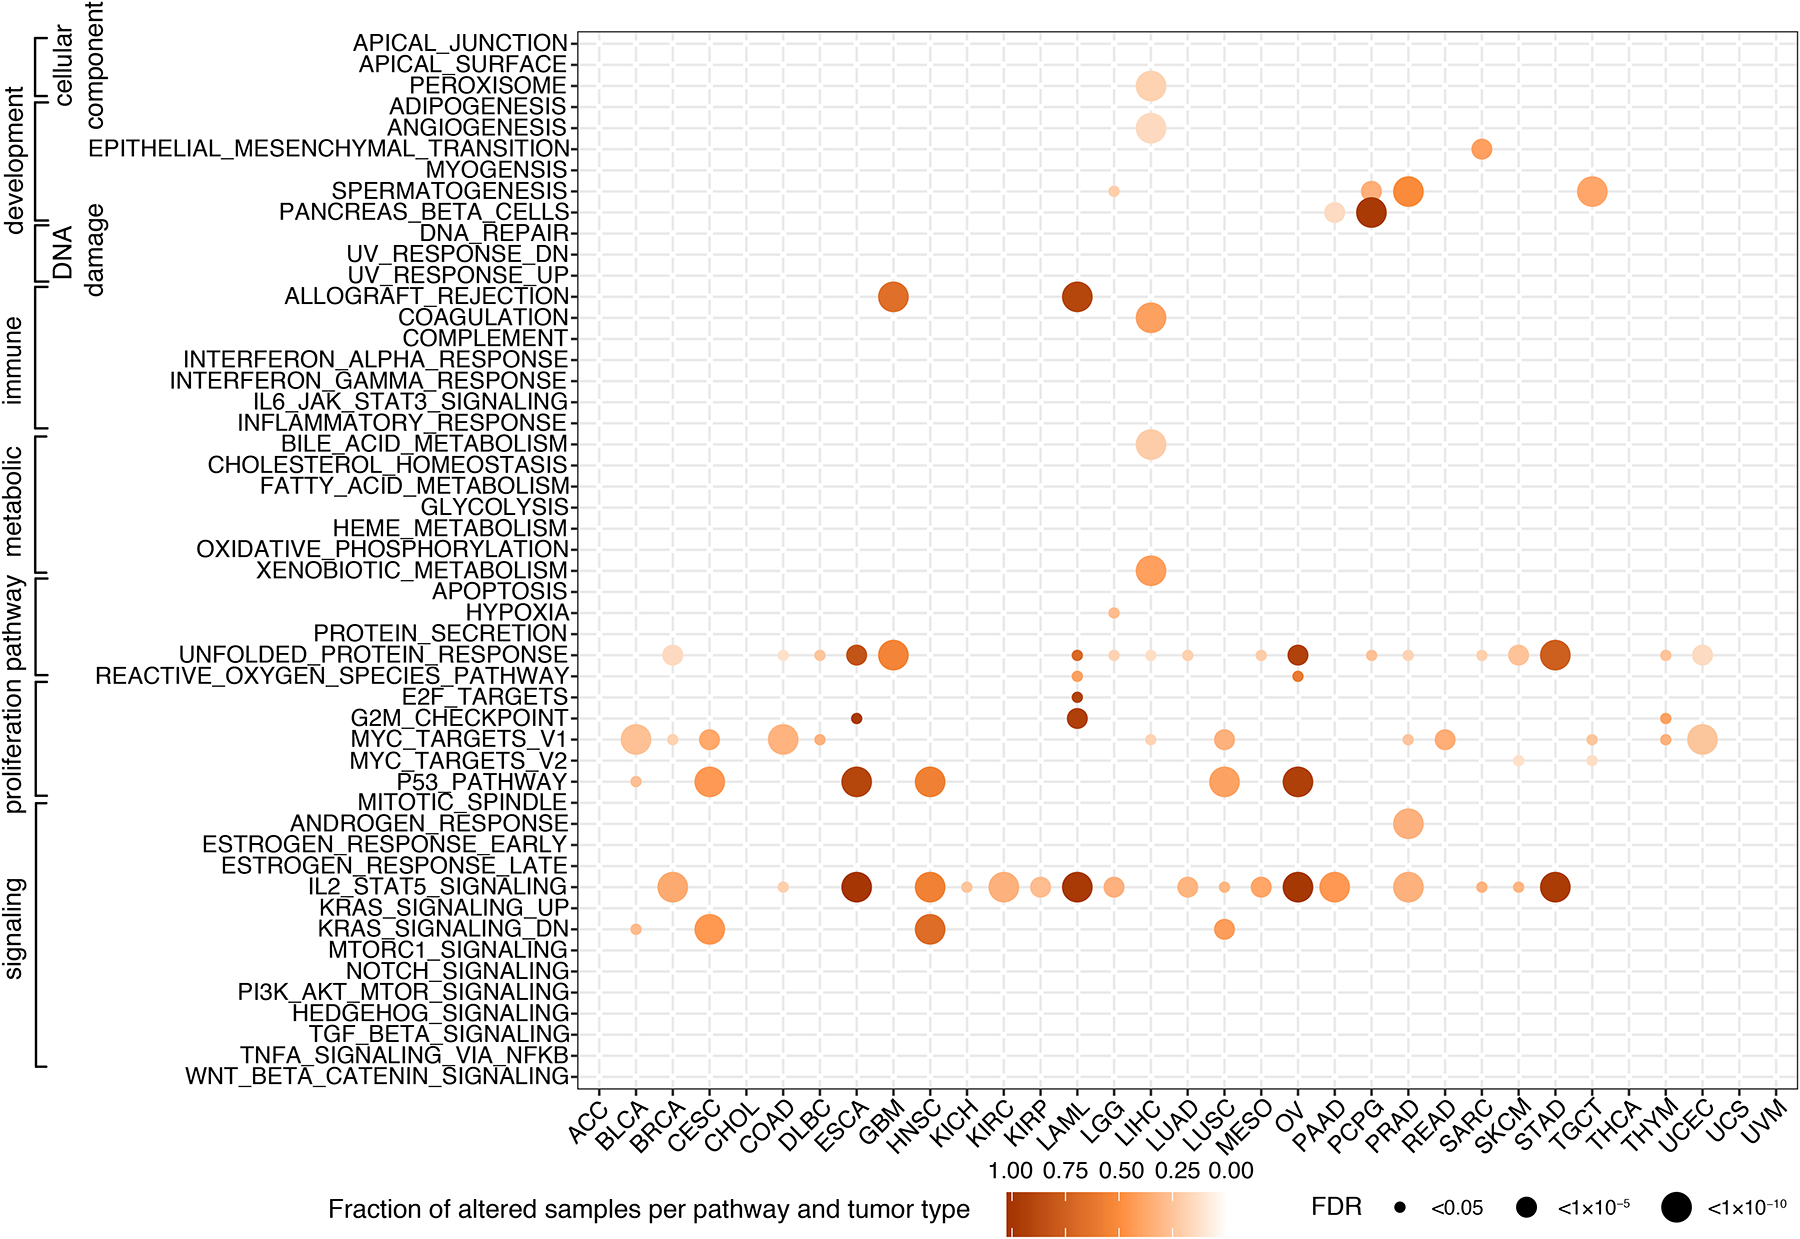
Figure 5. MsigDB hallmark gene sets affected by exitron splicing in TCGA cohorts.

The size of the circles represents the significance of TSE enrichment measured by FDR. Color indicates the fraction of TSE splicing altered samples per gene set and tumor type.
