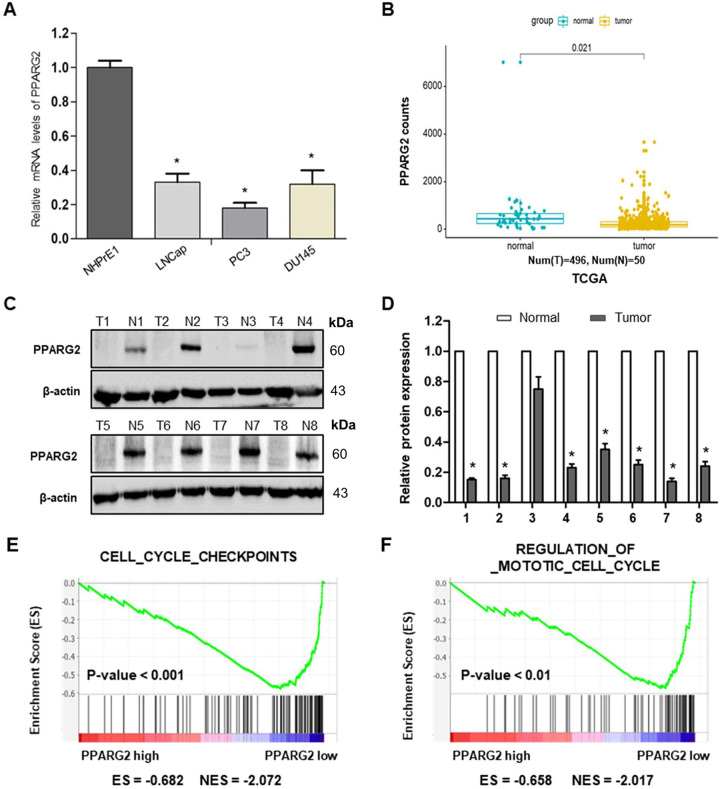
Fig. 1. PPARG2 is downregulated in PCA, negatively correlated with cell cycle-activated gene signatures.
A Relative mRNA expression levels were analyzed in different PCA cell lines and a normal prostate epithelial progenitor cell line NHPrE1 by qRT-PCR. *P < 0.05 vs. normal group. B Expression of PPARG2 in 496 PCA tissues (tumor) compared with 50 normal tissues (normal) in the TCGA profile. P = 0.021. C, D Western blotting analyses of relative PPARG2 protein expression in eight PCA tissues (T) and eight prostate hyperplasia tissues (N). *P < 0.05 vs. normal group. E, F GSEA plot showing the PPARG2 expression level correlated negatively with cell cycle-activated gene signatures (CELL_CYCLE_CHECKPOINTS, REGULATION_OF_MITOTIC_CELL_CYCLE).

