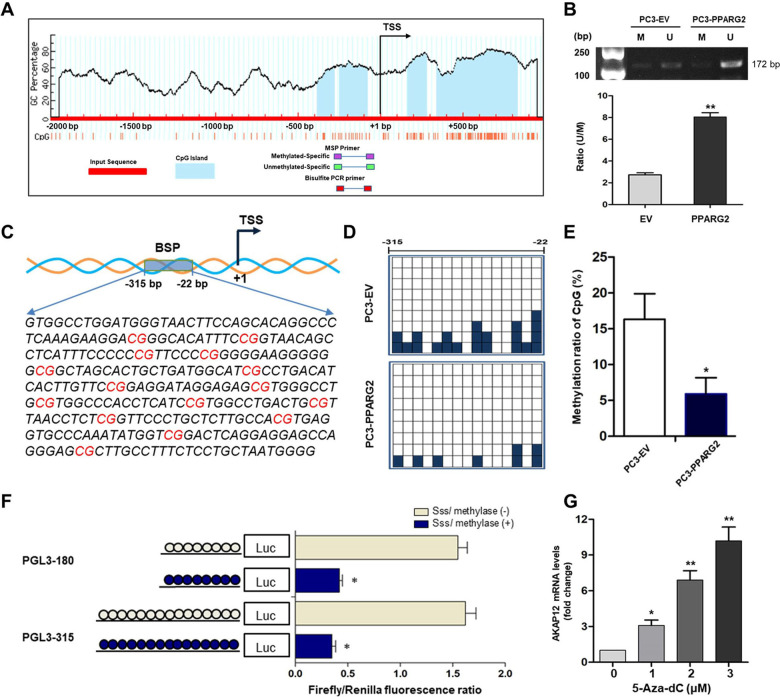
Fig. 6. Upregulated PPARG2 induces demethylation of the AKAP12 promoter region in vitro.
A Scheme for the location of the CpG islands near the TSS in AKAP12 gene. The CpG sites were indicated by vertical red lines. The regions for MS-PCR and BSP were indicated. TSS, translation start site. B Representative results of methylation analysis by MS-PCR in PC3 cell line transfected with EV or PPARG2 plasmid. M, methylation; U, unmethylation. **P < 0.01 vs. EV group. C Schematic region from −315 to −22 bp for BSP including 15 CpG sites in the AKAP12 gene promoter area. D BSP analysis of methylation status of the AKAP12 gene promoter. It is noteworthy that each small square indicates one clone. A total of nine clones were subjected to bisulfite sequencing. The methylated clones of individual CpG sites are labeled in dark blue. E The methylated clone ratio at −315 to −22 bp region of CpG sites. *P < 0.05 vs. EV group. F Two luciferase constructs treated with SssI methylase in vitro. *P < 0.05 vs. SssI methylase (−) group. G RT-qPCR analysis of relative AKAP12 mRNA expression in PC3 cell line treated with 5-Aza-dc at different concentrations. *P < 0.05, **P < 0.01 vs. group of 0 µM (5-Aza-dc).

