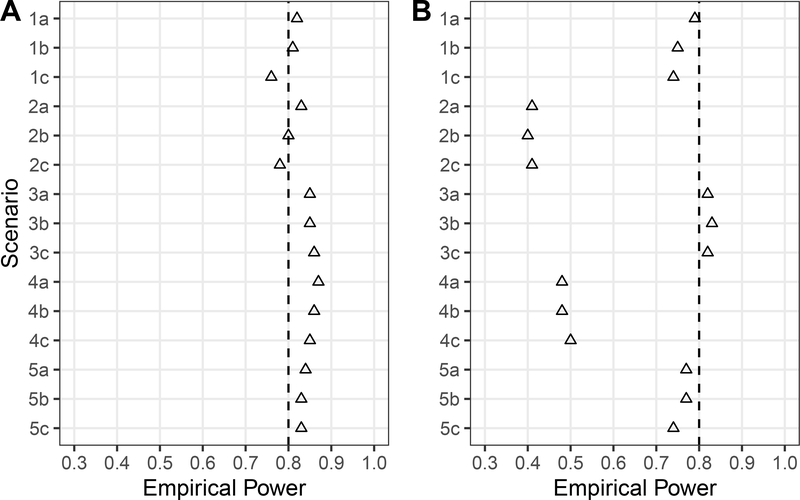
Figure 1.
Empirical power from the simulation study by scenario across R = 2000 samples based on sample sizes (A) ndeff and (B) nrct from Table 2. Empirical power is the proportion of simulated samples in which the p-value for testing H0 : β1 = 0 versus H1 : β1 ≠ 0 was less than α = 0.05 for the MSM E(Ya) = β0 +β1a. (Scenario 5c excludes 2 and 5 simulations for (A) and (B), respectively, in which the geex package failed to converge when estimating the standard error of .)

