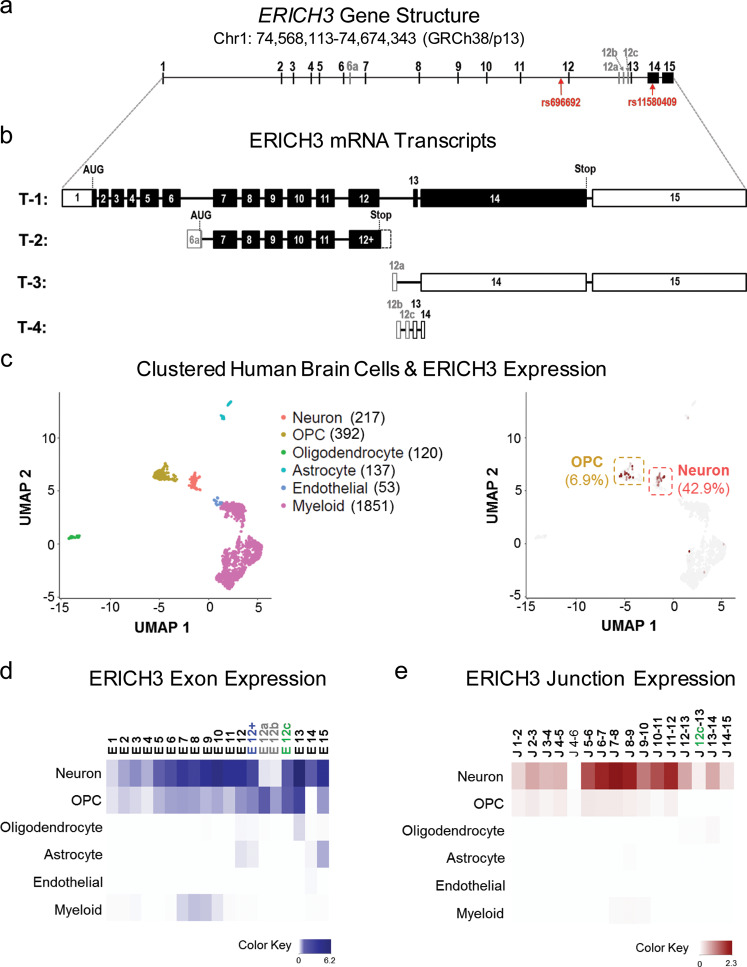
Fig. 1. ERICH3 gene structure and mRNA transcripts in human brain.
a Depiction of ERICH3 gene structure based on its physical location on chromosome 1 (GRCh38/p13). ERICH3 exons were numbered from 1 to 15 based on its reference mRNA transcript (Transcript ID: ENST00000326665). Alternative exons that map to intron 6 and intron 12 of the reference mRNA transcript were named with the intron number followed by a letter of the alphabet. The positions of the rs696692 and rs11580409 SNPs are also labeled. b ERICH3 transcript variants (T-1 to T-4) annotated by Ensembl. Exons depicted as solid boxes represent open-reading frames. Untranslated regions have been depicted as empty (white) boxes. Translation start codons and stop sites have been labeled as “AUG” and “Stop,” respectively. c Clusters of human brain cells were assigned cell types based on the expression of cell-type-specific marker genes quantified by single-cell RNA-seq. Each dot represents a single cell. Cell types have been color-coded and the number of sequenced cells of each cell type is listed in parentheses (left). ERICH3-positive cells were color-coded based on ERICH3 expression levels, and the ERICH3-negative cells are shown as gray dots. Neurons and oligodendrocyte progenitor cells (OPC) were two cell types that included the most ERICH3 positive cells. Percentages of ERICH3-positive cells in these two cell types are presented in parentheses (right). d Heat map of ERICH3 exon (“E”) expression in each CNS cell type. Darker color represents higher mRNA level. Exon 6a was not detected in any of the CNS cells. e Heat map of ERICH3 exon junction (“J”) expression. Darker color represents higher expression. In addition to the “canonical” exon junctions, a junction of alternative exon 12c to exon 13 (“J 12c-13”) was detected at low abundance in neurons.

