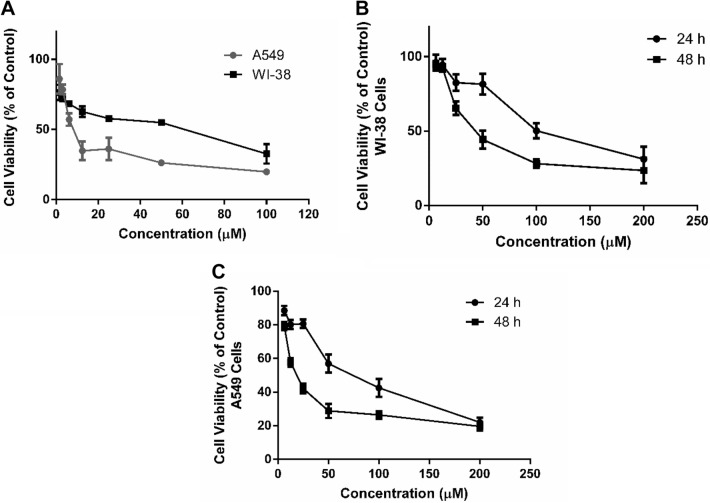
Fig. 1.
Cell viability assessment by MTS assay. A Effect of different concentrations of CYL against percentage of cell viability of WI-38 and A549 cells after 24 h incubation for evaluating IC50. B Cell viability-response curve of SES in WI-38 cells after incubation for 24 and 48 h for selecting the suitable therapeutic dose. C Cell viability response curve of SES in A549 cells after incubation for 24 h and 48 h. The experiments were performed independently in triplicates and data are expressed as Mean ± S.D. (n = 3)

