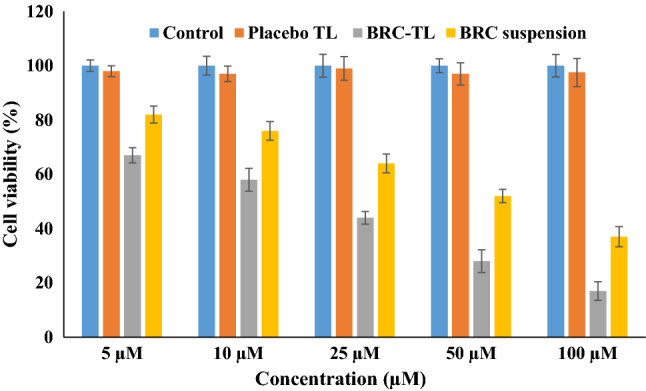
Fig. 7.

Representation of MTT assay results of cell viability following 48 h incubation of B16-F10 cells with placebo-TL, BRC-TL and BRC suspension. Results are expressed as the mean ± SD, (n = 3). Statistical inferences: no statistically significant difference between control vs placebo (P > 0.05); statistically significant difference between BRC-TL compared to control group, BRC suspension and placebo-TL (P < 0.05) at every concentration
