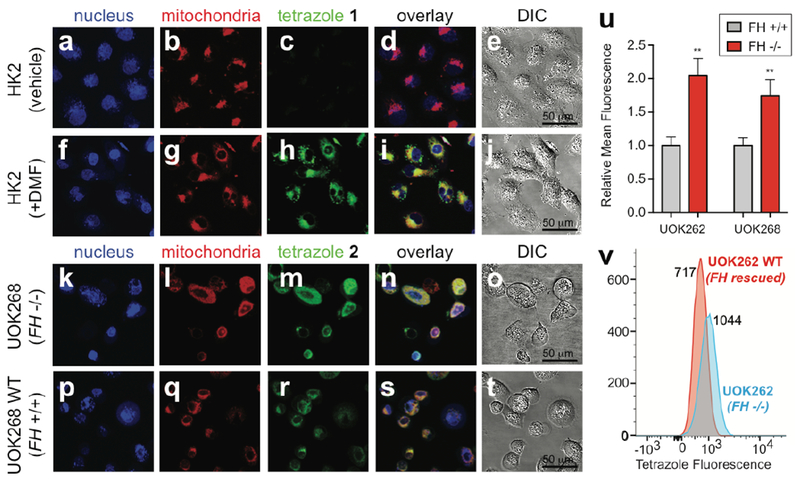
Figure 4.

Detection of dipolarophiles in living cells using tetrazoles. (a-t) Images from confocal microscopy experiments. HK2 cells were simultaneously treated with tetrazole 1 (100 μM, 2 h) and vehicle (DMSO, 2 h, a-e) or dimethylfumarate (DMF) (100 μM, 2 h, f-j). UOK268 (k-o) and UOK268WT (p-t) cells were treated with tetrazole 2 (100 μM, 2 h). All cells (a-t) were treated with MitoTracker Green FM (100 nM, 30 min) and DRAQ5 (200 nM, 30 min), washed, and, photoirradiated (302 nm, 2 min). Confocal images displayed are obtained for DRAQ5 (633 nm HeNe633 laser, false-colored blue, a,f,k,p), MitoTracker Green (488 nm argon laser, false-colored red, b,g,l,q), and tetrazole (820 nm two-photon laser, green, c,h,m,r). (d,i,n,s) represents overlay of confocal images and (e,j,o,t) represents differential interference contrast (DIC) microscopy images with a 50 μm scale bar. (u) Mean fluorescence intensities of tetrazole fluorescence quantified from confocal images for UOK262 (FH −/−) relative to UOK262WT (FH +/+), and UOK268 (FH −/−) relative to UOK268WT (FH +/+). Total 10 cells were analyzed per cell line. Error bars denote SEM. Statistical significance analysed by unpaired t test (n = 3, ***P < 0.001). (v) Histograms obtained via flow cytometry analysis of UOK262 (FH −/−) and UOK262WT (FH +/+) cells treated with tetrazole 2 (100 μM, 2 h; followed by washing and photoirradiation).
