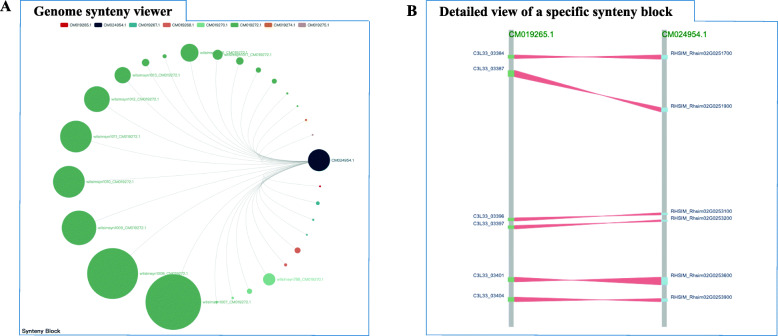
Fig. 3.
Genome synteny viewer. a Syntenic blocks displayed in a circus plot. The darkslategray circle represents the query chromosome. Besides, the same color represents the same chromosome, and different circles of the same color represent different syntenic blocks located on the same chromosome. Additionally, the lines between darkslategray and other colors represent syntenic blocks identified between the two genomes. By the way, all blocks of this chromosome can be made to disappear from the image by clicking on the color that represents that chromosome. b Detailed view of a specific synteny block. The two gray lines represent the chromosomes of different species, and the red areas represent homologous gene pairs

