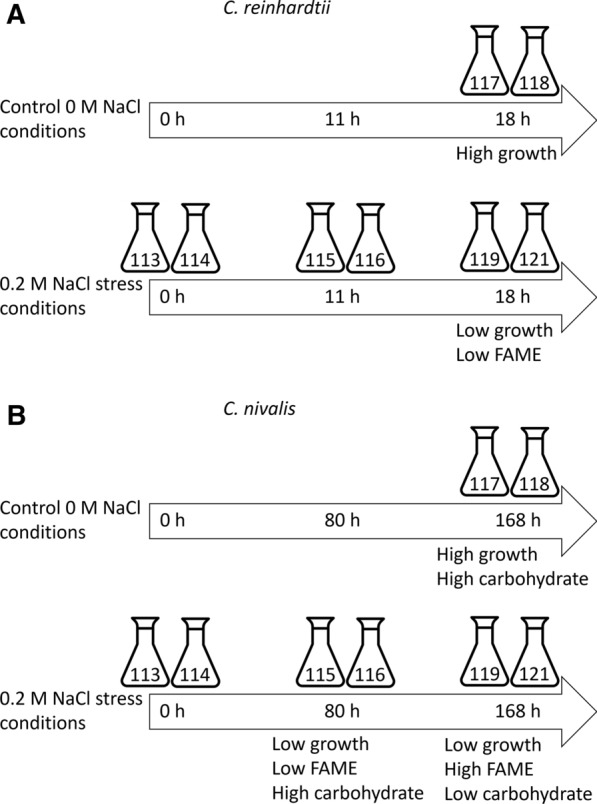
Fig. 3.

Quantitative proteomic analysis experimental set-up using 8-plex iTRAQ. Two 8-plex iTRAQ experiments were performed for C. reinhardtii (A) and C. nivalis (B). Four conditions (time 0 salt stress, early log-phase salt stress, mid-log phase salt stress, and time-matched mid-log control), two biological replicates of each, were compared for each species. The assigned iTRAQ labels are shown for each condition and replicate. Time points were selected at which C. nivalis was producing carbohydrate (early log) and fatty acids (mid-log) in response to 0.2 M NaCl stress, with the equivalent points of the growth curve selected for C. reinhardtii
