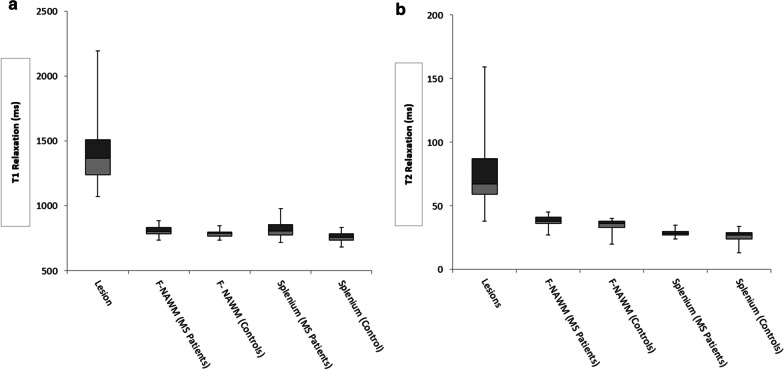
Fig. 5.
Box and whisker plots for differences in T1 (a) and T2 (b) mean relaxation times between the structures analyzed. The vertical lines depict the ranges, the light boxes the second quartile, the dark gray boxes the third quartile and the solid vertical line the median. For the lesions, the 25th percentile (T1; T2: 1240 ms; 59 ms), median (T1;T2: 1368 ms; 67 ms), 75 percentile (T1;T2: 1509 ms; 87 ms) were higher compared to all the anatomical structures. The T1 and T2 scales are on milliseconds (ms). F-NAWM: frontal appearing normal white matter

